


Foreword
Positive economic news has abounded in the past year, with reports of a strong job market, low unemployment numbers, continued wage growth, and reduced levels of inflation regularly in the headlines. The financial upheaval that characterized so much of the last several years appears to have receded well into the distance.
And yet, rather than seeing improvements in the economic stability of individuals across the region, and an associated reduction in the need for food assistance, the Capital Area Food Bank (CAFB) and its network of nonprofit partners have seen the opposite: the number of people seeking help has been climbing higher. Last fiscal year, CAFB distributed the food for 64 million meals – more than double its pre-pandemic levels, and five million more than the year prior.
In short: beyond the upbeat macroeconomic narrative, there is clearly another, very different reality unfolding for a growing number of people.
To explore this discrepancy, the food bank once again partnered with trusted independent social research organization NORC at the University of Chicago to conduct a general population survey about food insecurity and inequity in the region. General population surveys are the most reliable and accurate tools available for understanding the prevalence of key issues in the context of broader society. Now in its third year, the CAFB/NORC survey reflects data gathered from nearly 4,000 residents of Greater Washington.
The results show that far from receding, food insecurity has seen a dramatic uptick. The percentage of people in need in our area has risen significantly in the last year, both overall and across every county surveyed.
This year’s report explores the multiple, often compounding forces making it difficult for an increasing number of our neighbors to put food on the table. These include the cumulative weight of inflation on living costs over the past four years; ongoing employment challenges and wage stagnation that have severely undercut the purchasing power of many residents; and the impacts of a full year without the government supports that blunted the worst financial hardships of the pandemic.

Beyond illuminating food insecurity’s key drivers, Hunger Report 2024 reveals surprising new trends in the economic profiles of those experiencing food insecurity, showing that rates have spiked among middle income households. And it continues to shed light on many of the known correlations between food insecurity, race, educational attainment, and geography in our region, underscoring the ongoing effects of longstanding systemic racism and structural inequities.
Additionally, this year’s report contains new data about the seemingly impossible choices that many people must make when faced with a limited budget, including trade-offs between food and housing, transportation, healthcare, credit card payments, and other critical expenses – all of which can have negative long-term results. The report also puts numbers to some of the most dire outcomes of having a budget that won’t stretch to cover all of a household’s necessities, including the prevalence of adults skipping meals or, most wrenchingly, seeing children go without food.
Finally, as in past years, we have devoted a significant portion of this report to exploring the path forward. As the socioeconomic disparities in our area continue to expand, the need for all sectors to act – and to do so collaboratively – is becoming greater and more urgent. Allowing food insecurity and economic inequity to grow unchecked has profoundly negative consequences– both for individual lives, and for our region writ large. There is a role for everyone –– including corporations, nonprofits, and governments at every level – to play in providing our neighbors with the resources and support they need. Together, we can help reverse these trends and build a community in which all people can thrive.

Food Insecurity Trends in Greater Washington
Food insecurity across our region
Having completed this study for the third year in a row, the Capital Area Food Bank (CAFB) and National Opinion Research Center (NORC) now have enough data to begin charting trends in the prevalence, severity, and geographic distribution of food insecurity across the Greater Washington region. Comparing 2024 to previous years reveals a trajectory that many would not expect one year out from the official end to the pandemic: across virtually every category of geography, income, race, and more, food insecurity is on the rise.
Regional trends
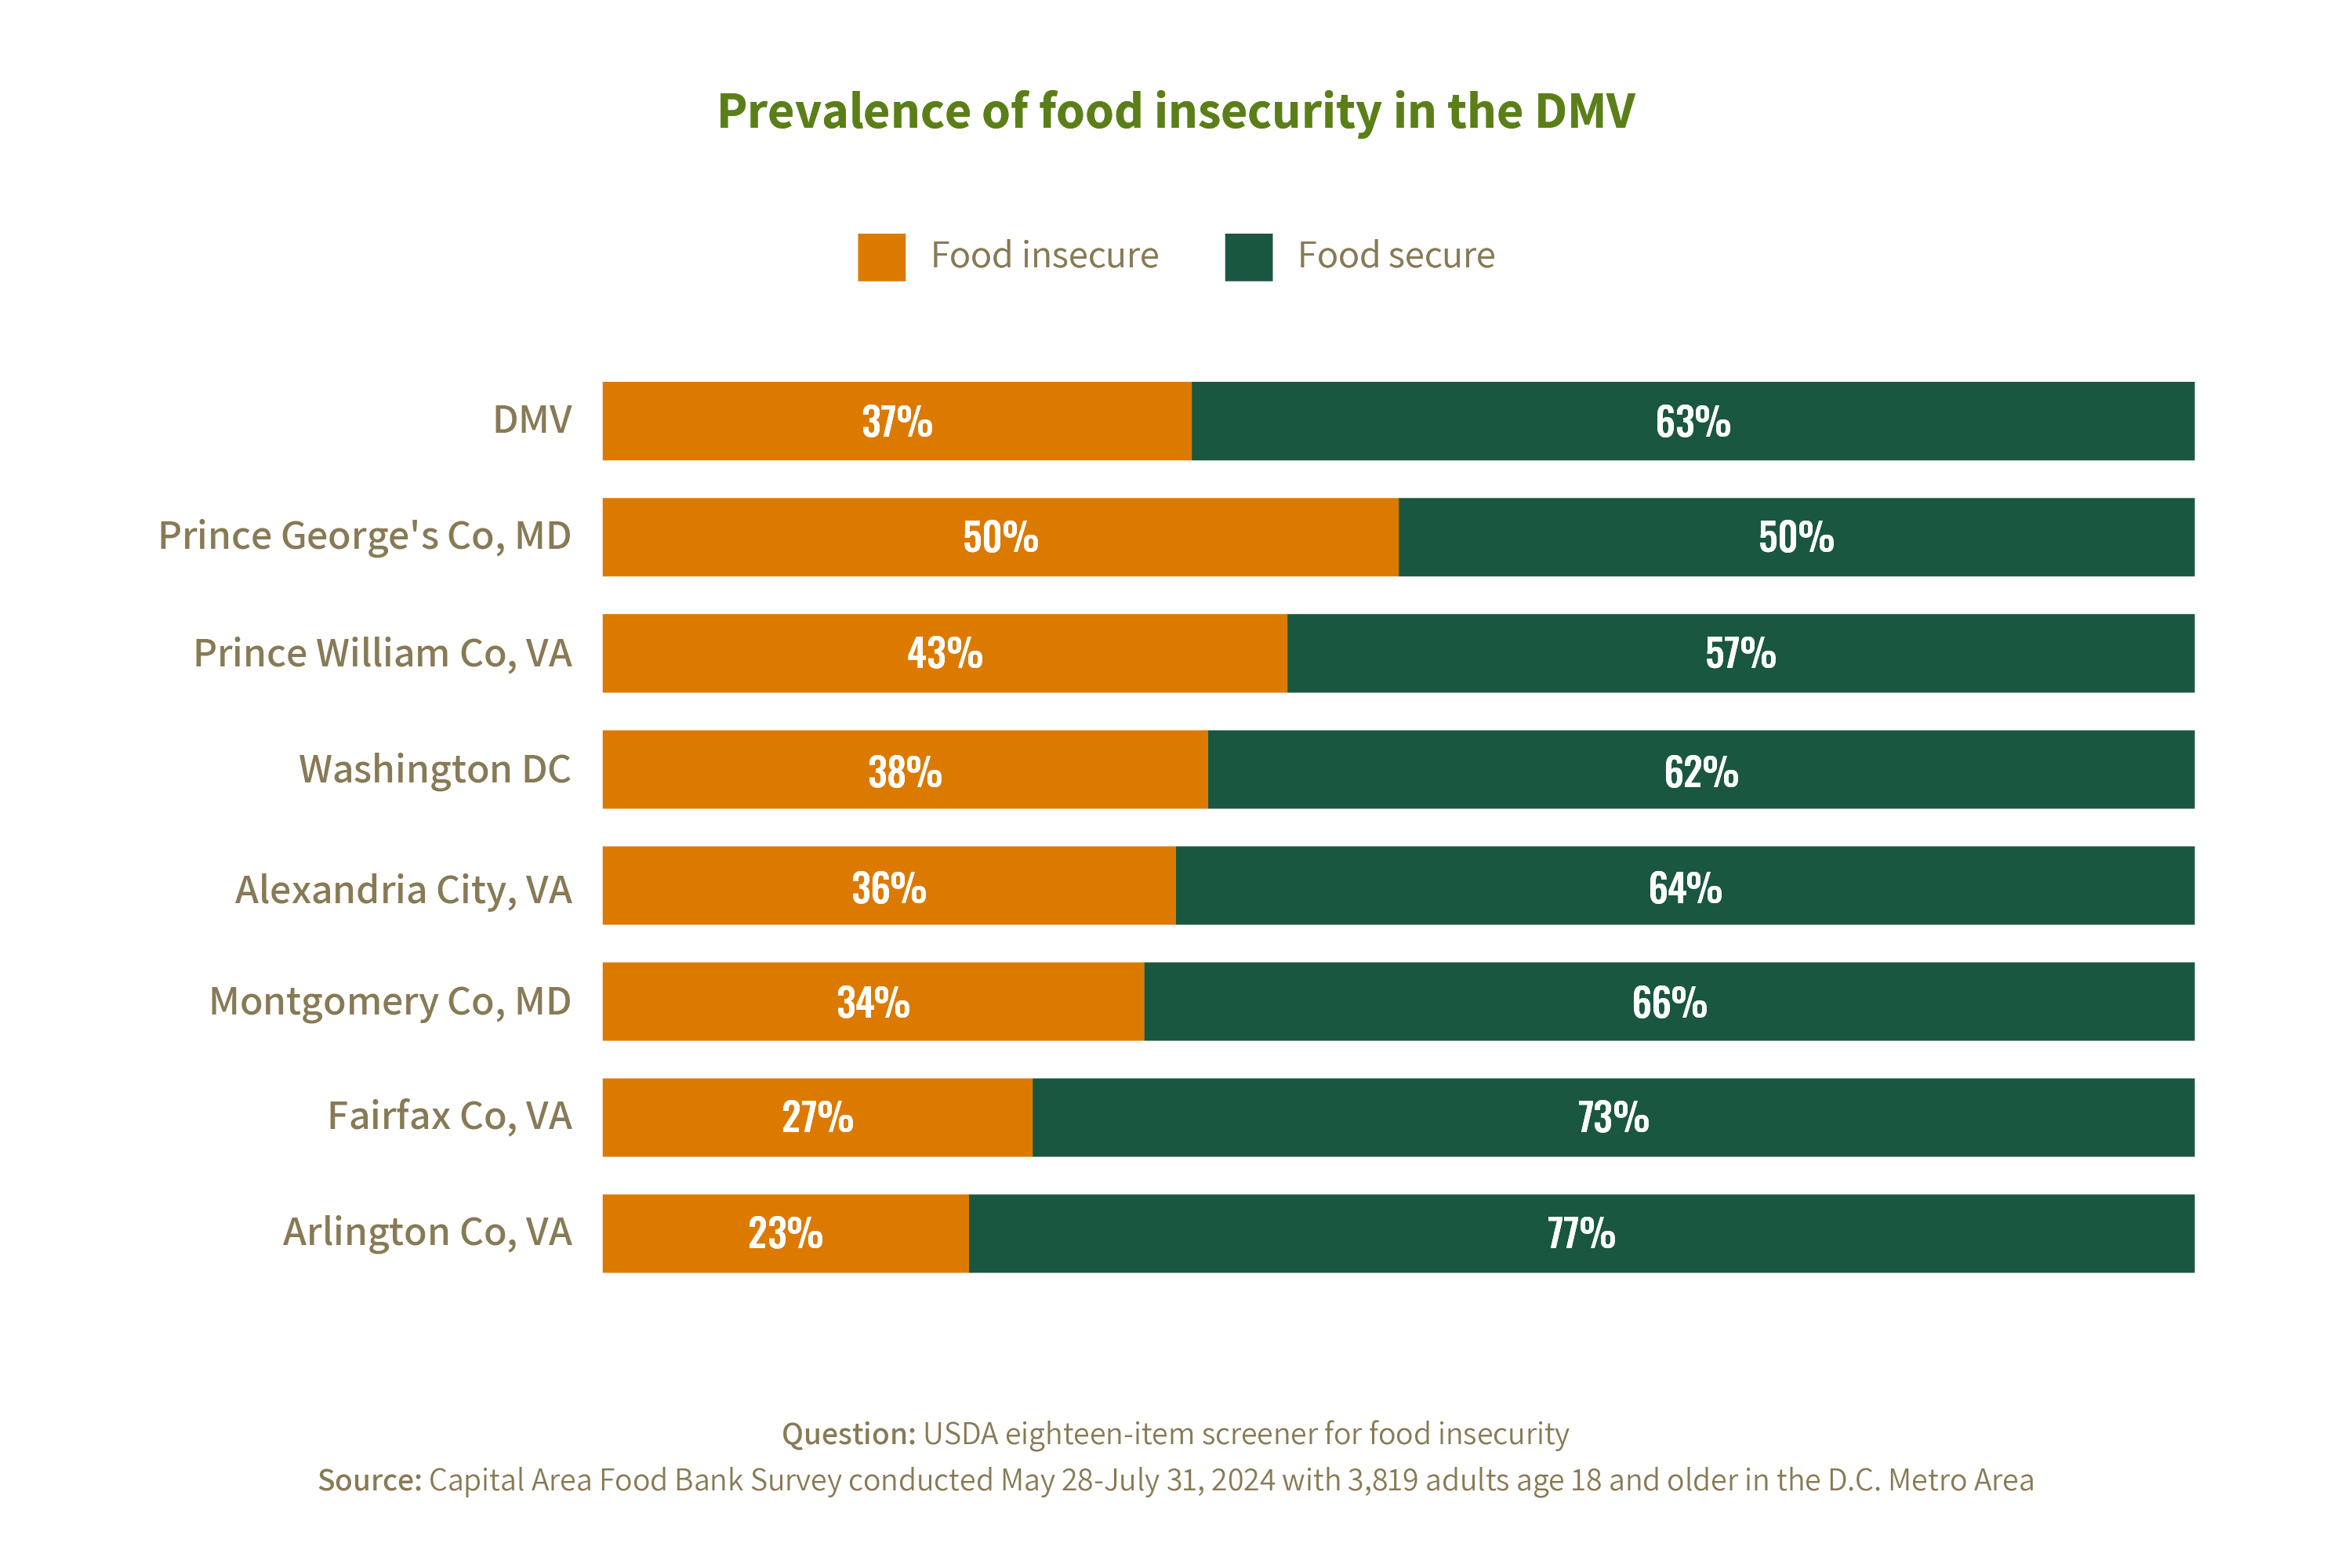
Even as the strong economy continues to make headlines, data from over 3,800 households across the DMV suggests that things are not getting better. In 2024, the CAFB-NORC general population survey found that 37% of households experienced food insecurity in the year prior to the survey (May 2023 to May 2024).
Across virtually every category of geography, income, race, and more, food insecurity is on the rise.
Prevalence of food insecurity in DMV
Question: USDA eighteen-item screener for food insecurity
Source: Capital Area Food Bank Survey conducted May 28–July 31, 2024 with 3,819 adults age 18 and older in the D.C. Metro Area
This is up five percentage points from 2023, when the prevalence rate of food insecurity was 32%. It is also the highest level of regional food insecurity seen since the CAFB-NORC survey began in 2022. The implication is clear that despite positive macro level economic trends over the past year, the number of people struggling to make ends meet has not declined and indeed, is rising.
County-level trends
Within the DMV, a wide range of experiences exists across the different counties. Prevalence rates for food insecurity span from a low of 23% in Arlington, VA – still one in four households – to a high of 50% in Prince George’s County.
Looking more closely at county-level trends between 2022 and 2024, slightly different patterns emerge, but all of them culminate in higher rates this year than before.
Prevalence of food insecurity by county
Question: USDA eighteen-item screener for food insecurity (2023 & 2024) and USDA six-item screener (2022)
Sources: Capital Area Food Bank Surveys conducted May 28-July 31, 2024 with 3,819 adults, May 1-15, 2023 with 5,261 adults, and February 4-March 2, 2022 with 3,769 adults age 18 and older in the D.C. Metro Area
Insights on who is experiencing food insecurity
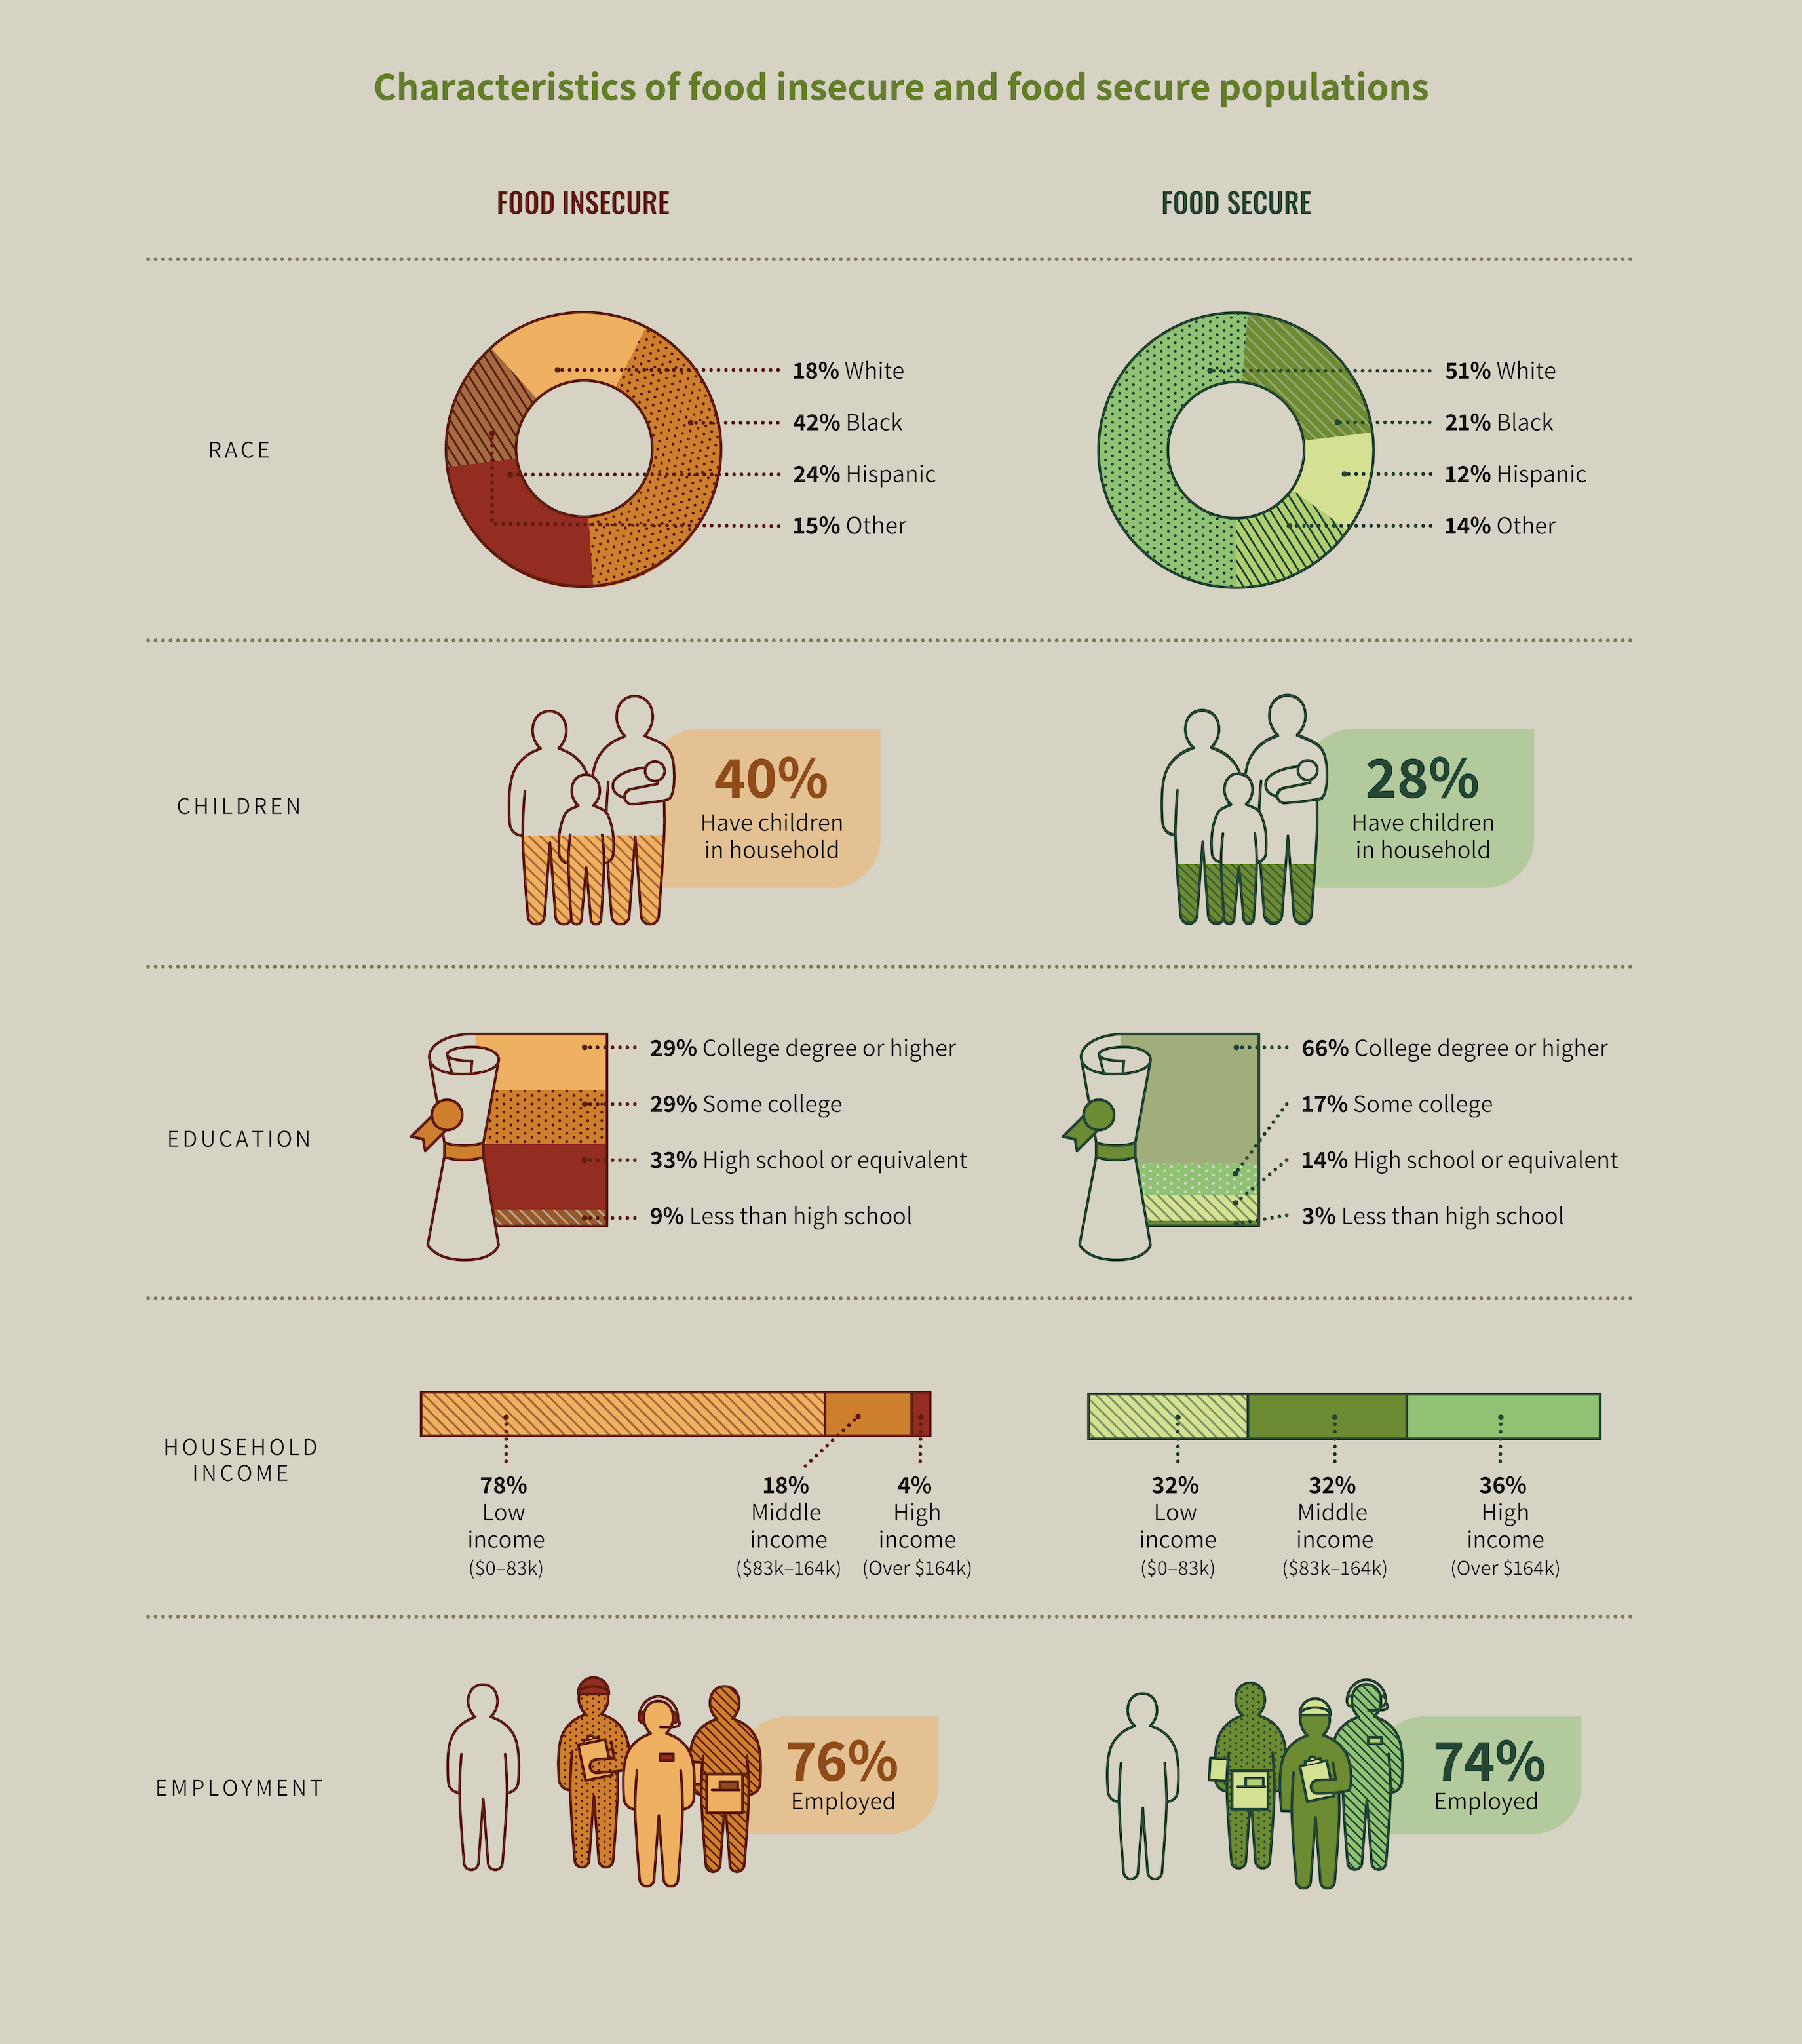
Understanding the unique composition of the food secure versus food insecure populations helps shed light on the underlying forces that impact who experiences food insecurity in Greater Washington. As noted in past years, the food insecure population is disproportionately comprised of people of color, families with children, and those with lower incomes and levels of education. However, looking at trends year over year, it stands out that the food insecure population is growing increasingly educated and more middle-class.
I graduated from college with honors. But the competition for jobs is fierce.
Race
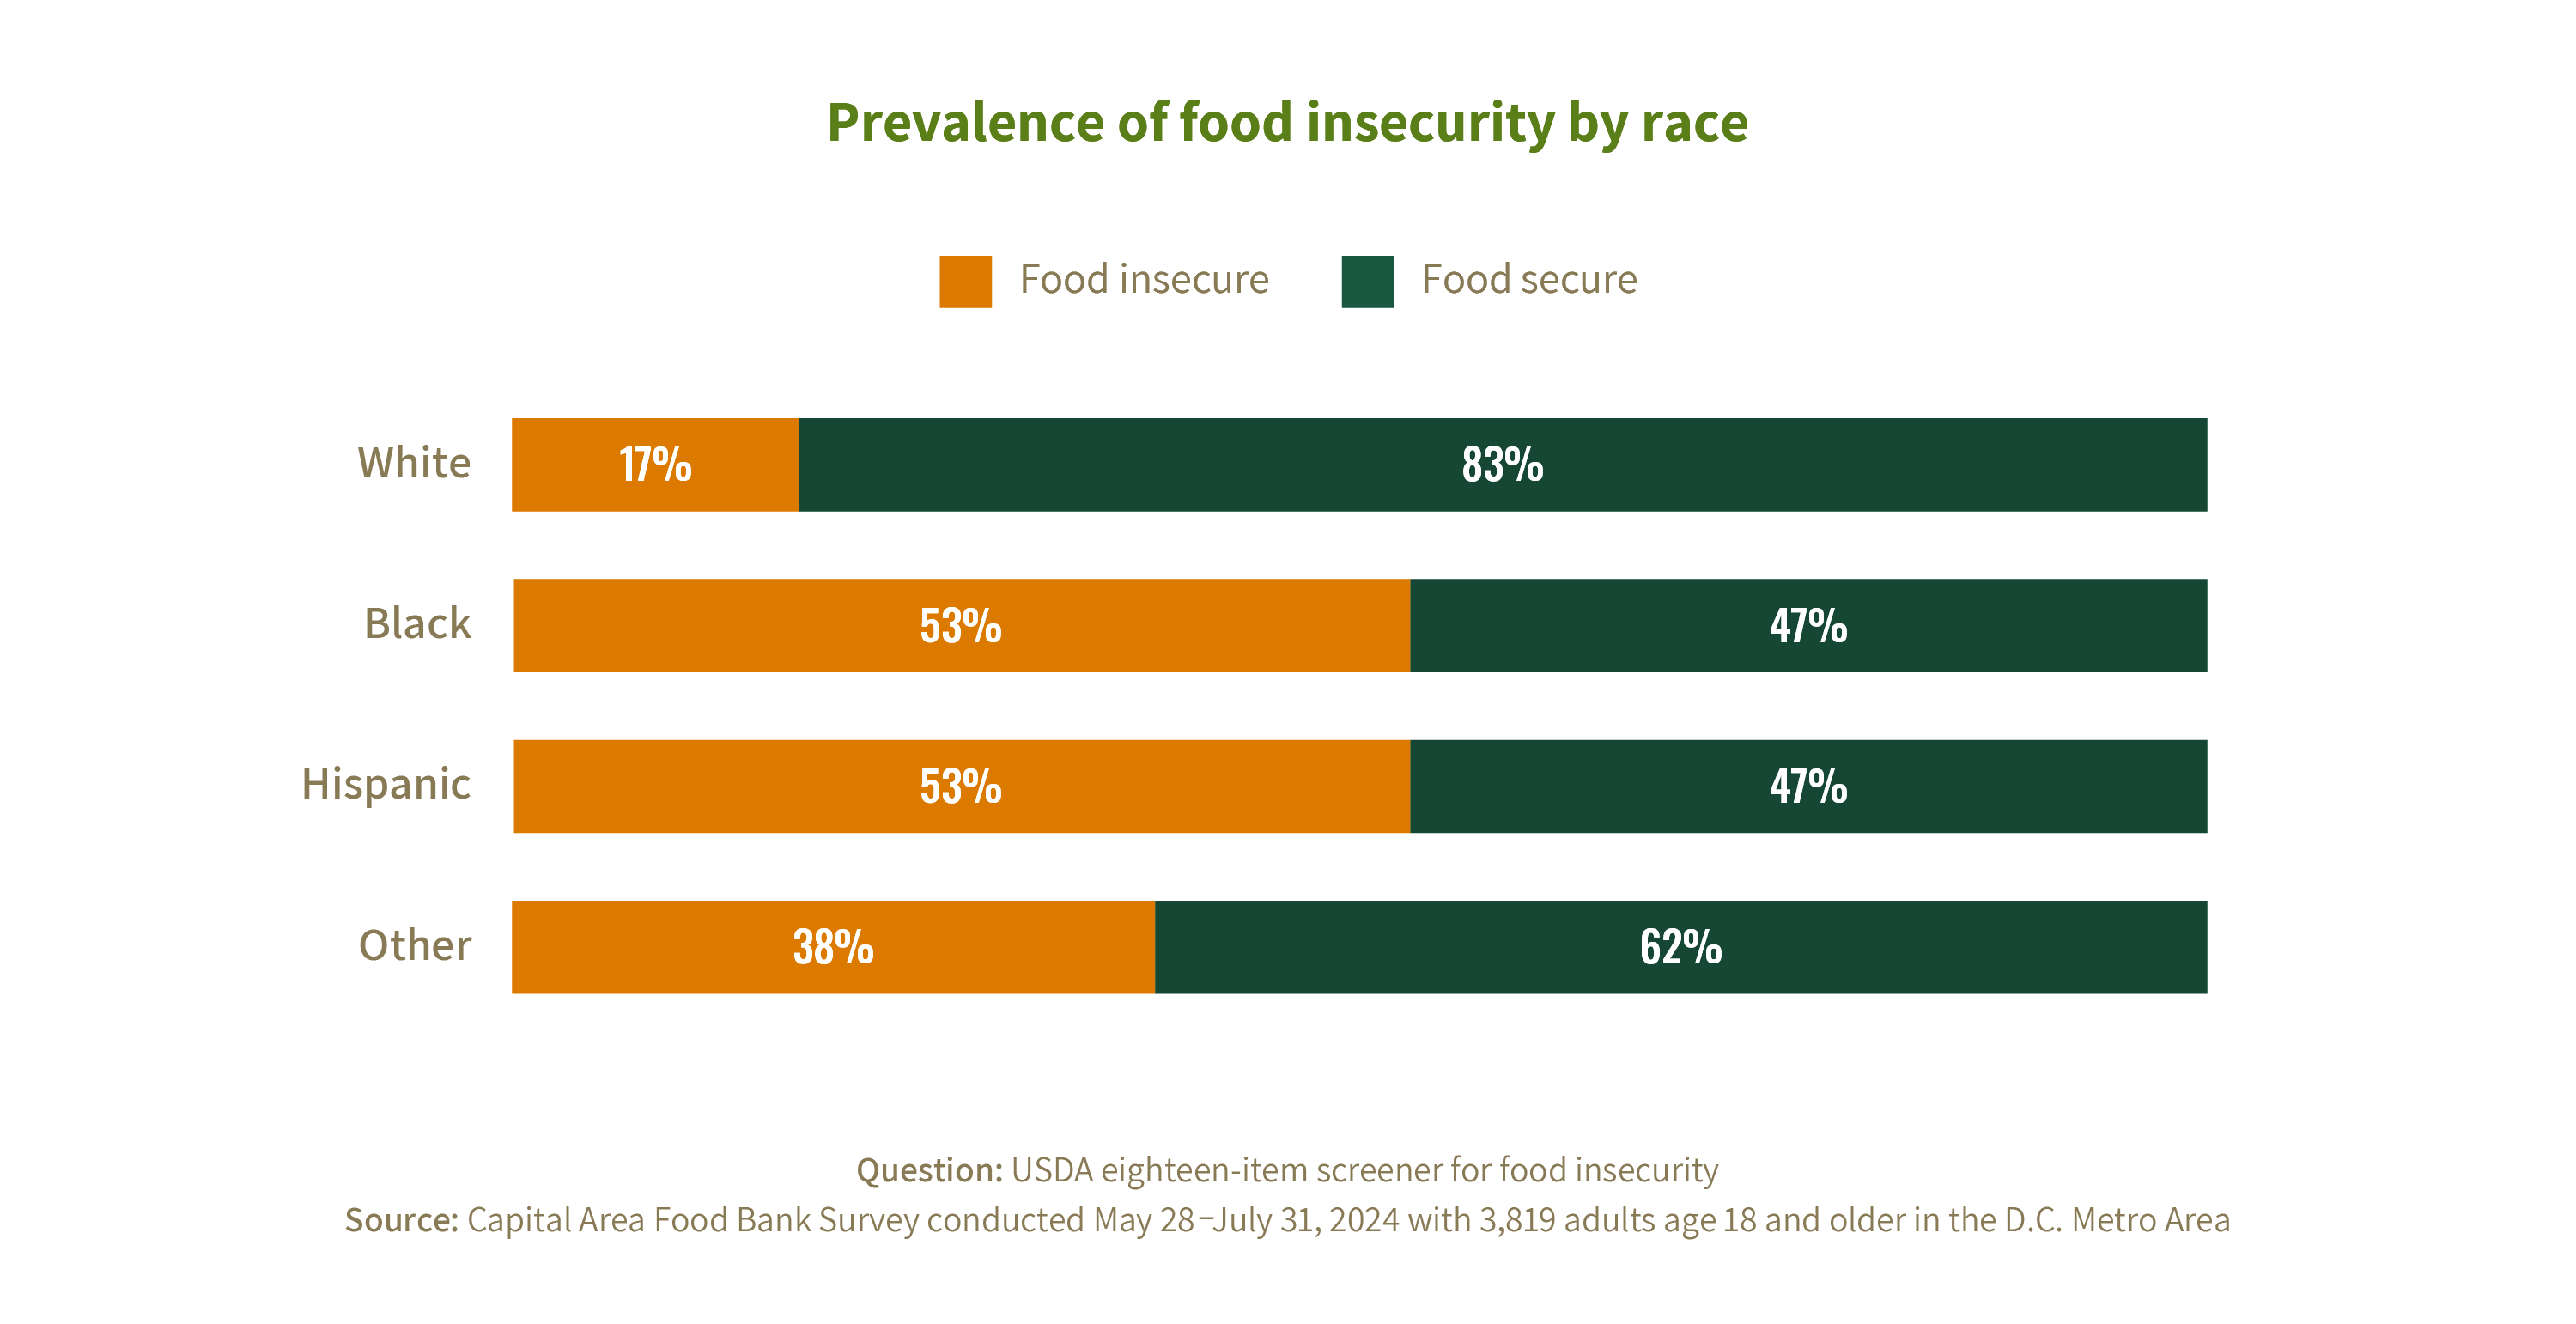
In the last several years, the relationship between race and economic prosperity in the United States has been thoroughly examined and exposed as systemically inequitable. In foundational economic categories such as wealth building, education, and income, there exist deep disparities in outcomes by race, due to decades of systematically racist practices. Food insecurity rates in Greater Washington in 2024 follow this same, troubled pattern: people of color are still 2-3x more likely to be food insecure than white people in our region.
Income
In 2023, the Capital Area Food Bank found that one-fifth of households making the median income of $120,000 in Greater Washington were food insecure. This finding contributed to the growing body of evidence that the cost of living in this region, as in many other urban areas, is dramatically out of alignment with wages for many.
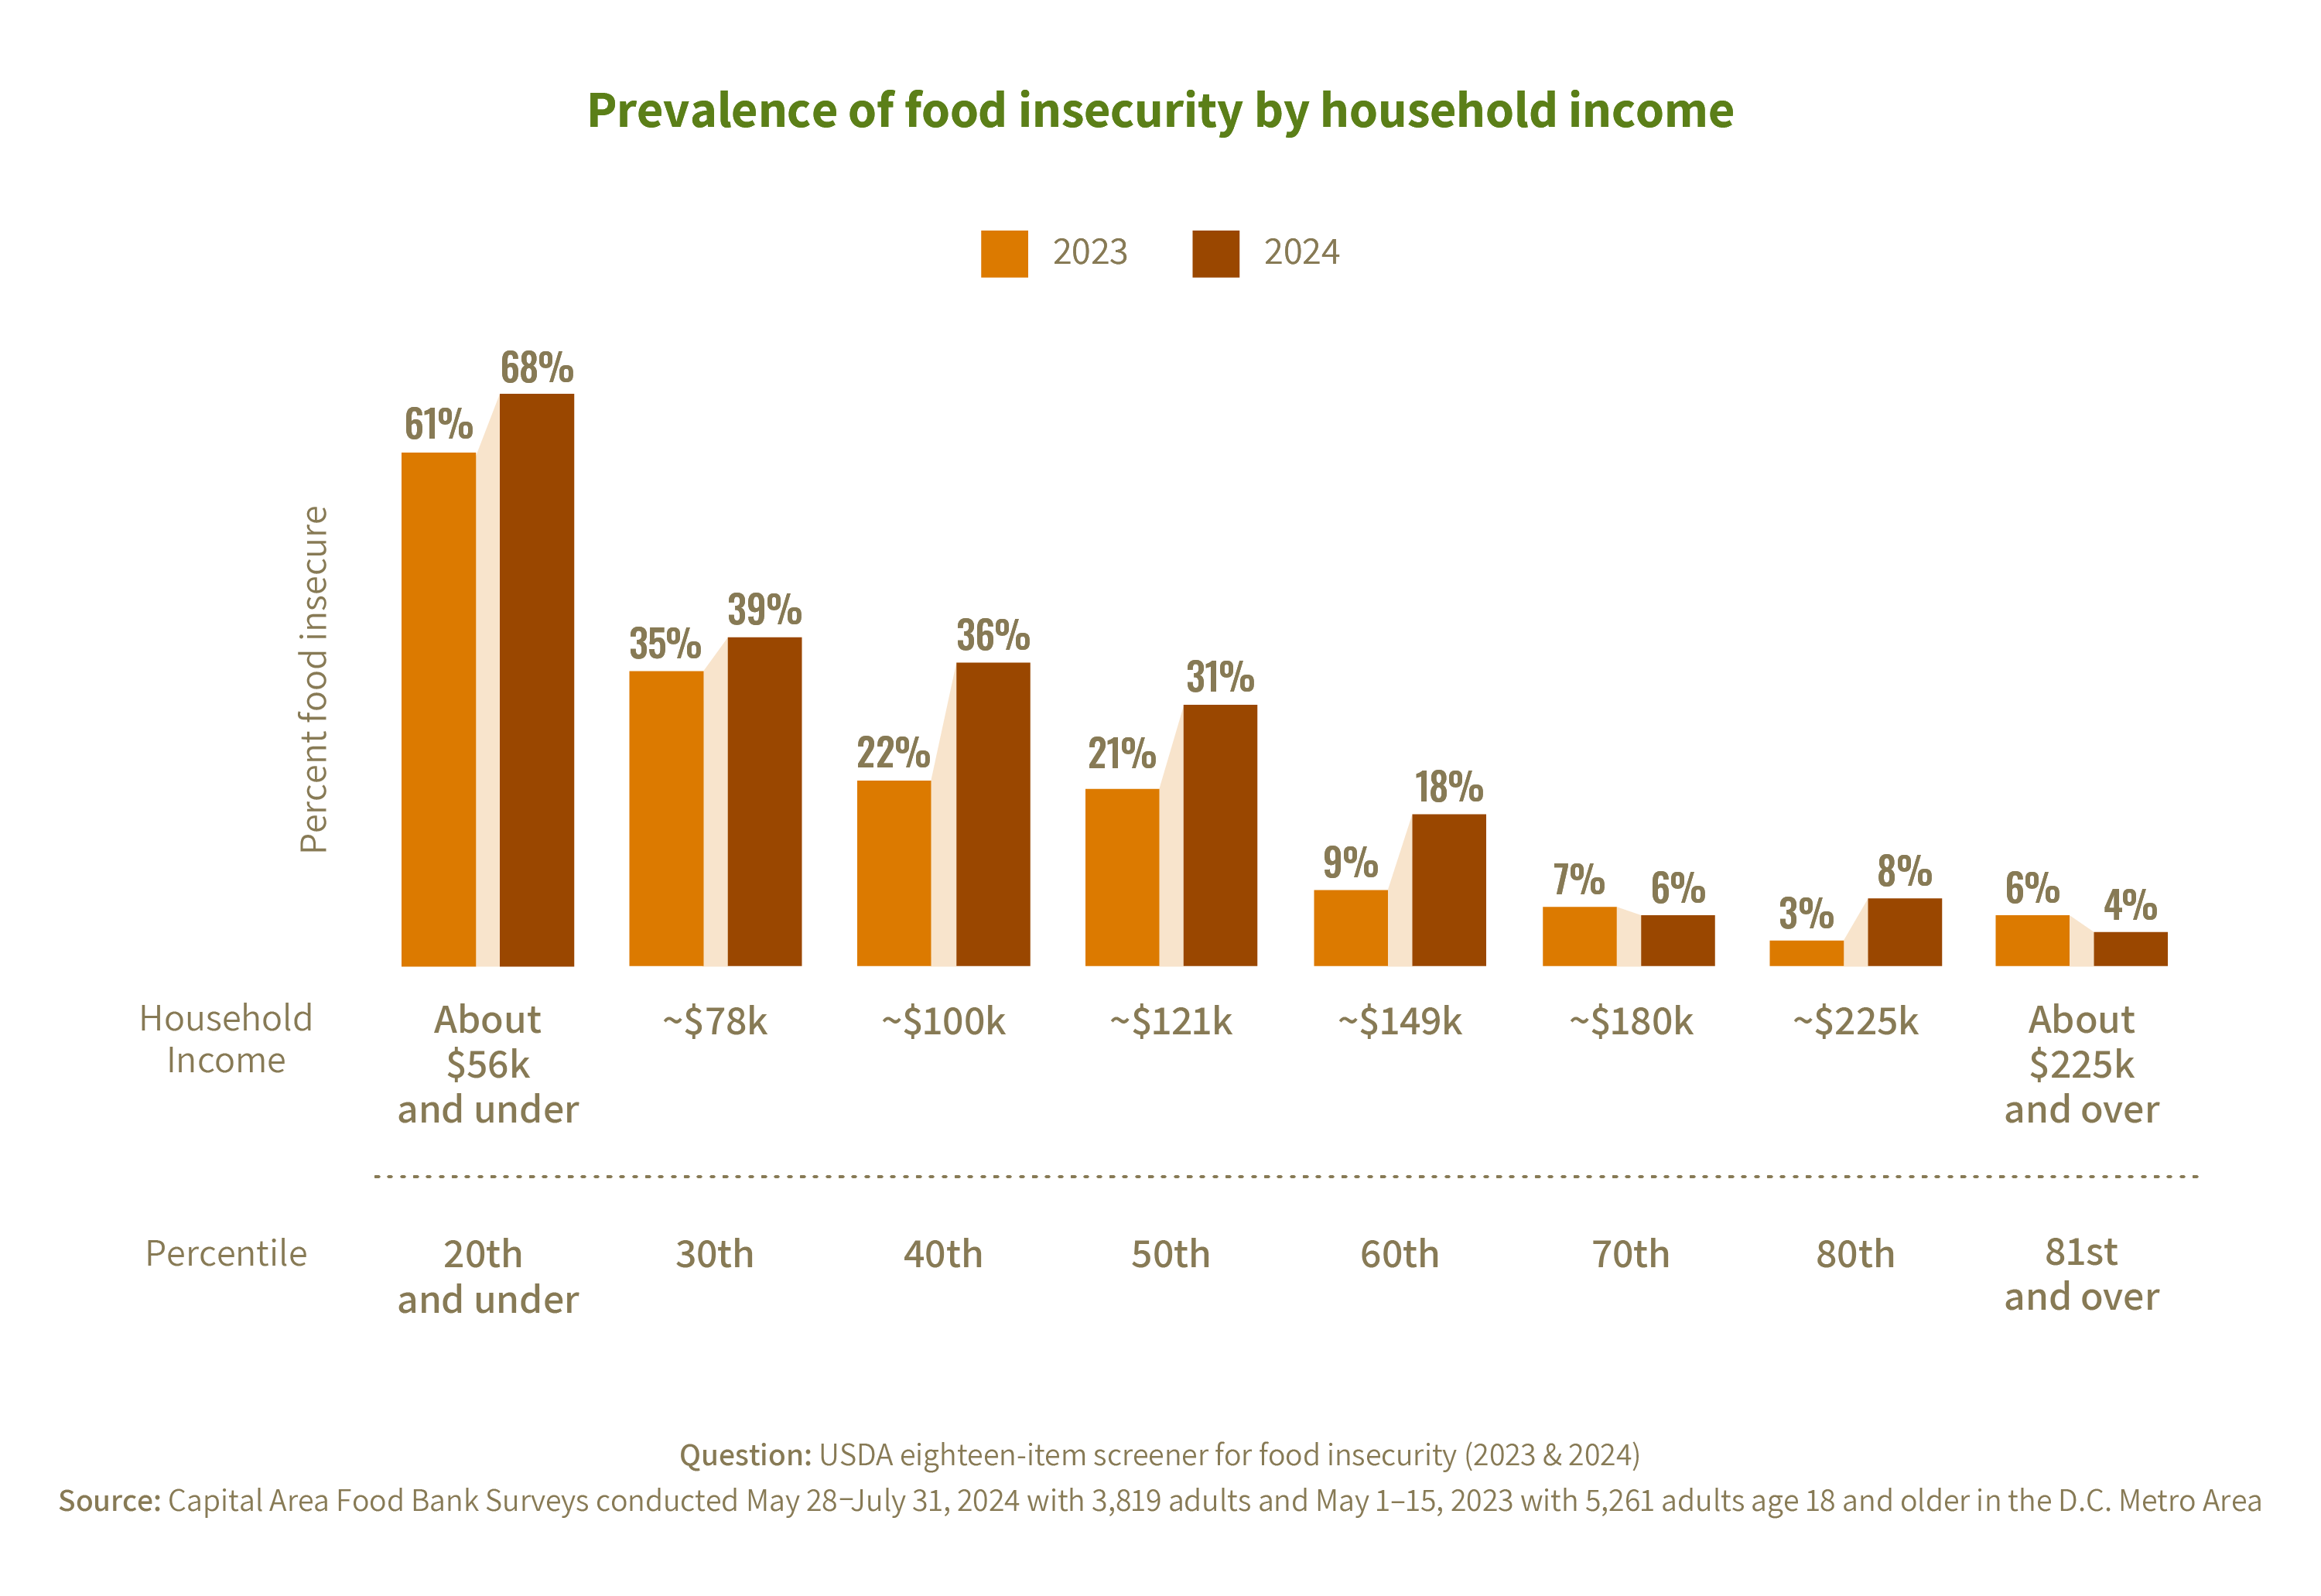
Further evidence of this problematic trend can be seen in the CAFB-NORC study’s finding that higher rates of food insecurity exist in almost every income decile, but that the greatest rates of increase were in the middle-income groups – households earning approximately $100k to $150k.This trend of increasing food insecurity in the middle class is related to several economic factors, which are explored in detail in the following section of this report.
The greatest rates of increase were in the middle-income groups – households earning $100k-$150k.
Education
Another area where a trendline has emerged is in the educational attainment of the food insecure population. Compared to years past, the food insecure population now has a higher number of college graduates, almost one-third of the group. And, as in previous years, well over half of the food insecure population has more than a high school diploma. While the correlation between higher education and earnings is well-documented, this trend strongly indicates that in some cases, a college degree is not enough to prevent food insecurity in Greater Washington.
Change in educational attainment of food insecure population
Question: USDA eighteen-item screener for food insecurity (2023 & 2024) and USDA six-item screener (2022)
Sources: Capital Area Food Bank Surveys conducted May 28-July 31, 2024 with 3,819 adults, May 1-15, 2023 with 5,261 adults, and February 4-March 2, 2022 with 3,769 adults age 18 and older in the D.C. Metro Area
Employment
Consistent with findings from the last two years, the food insecure population in the labor force (meaning those not retired or disabled) was 76% employed. Amongst the food secure, employment rates were functionally equivalent at 74%, which was also consistent with previous years’ findings. These similar rates of employment point to broader trends of unequal access to well-paying jobs, education, and upward mobility in careers.
These similar rates of employment point to broader trends of unequal access to well-paying jobs, education, and upward mobility in careers.
For many food insecure households, even having multiple jobs is not enough to make ends meet. Of those who are working, 1 in 5 (20%) have more than one job, compared to just 7% of their food secure counterparts. The pervasiveness of this experience – holding multiple jobs and still being unable to consistently afford food – accentuates the disconnect between wages and the cost of living in this region.
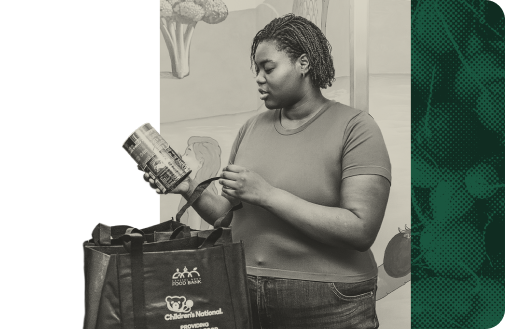
Chelsi, a single mom with a bachelor’s degree, works full time but still struggles to support her three kids. To make ends meet, she takes on extra jobs, missing valuable time with her family.
Household composition
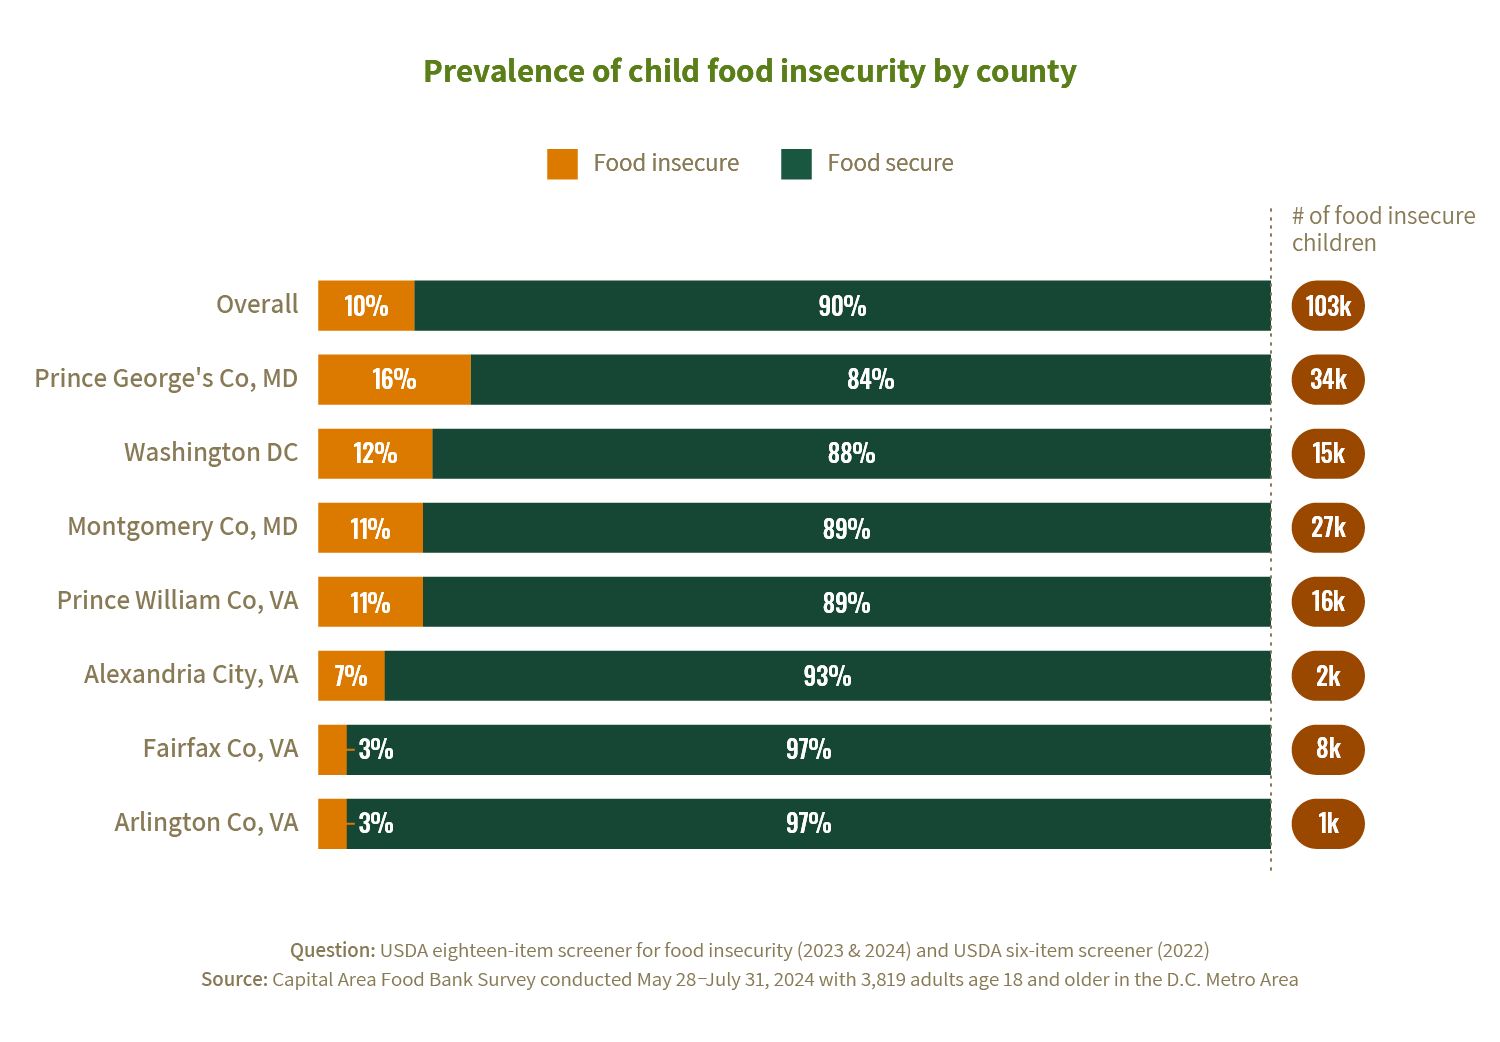
Household structures are notably different between food secure and food insecure households. Importantly, food insecure households are more likely to have children living in them: 40% have children, compared to just 28% of food secure households. The rate of food insecurity among children is traditionally lower than the general household prevalence rate as adults willingly make personal sacrifices to ensure children are fed. Still, the prevalence of food insecurity among children in the Greater Washington area is significant: 10%, equating to 103,000 food insecure children across the region.
The composition of food insecure households is also distinct from their food secure counterparts in terms of marital status, presence of older adults, and average total size. Food insecure households are less likely to have adults who are married – just 37%, compared to 58% in food secure households – which is correlated with lower economic wellbeing. Food insecure households are also less likely to include adults over the age of 60, except in Washington DC, which has a high rate of food insecurity among seniors. Average household size for food insecure households is larger – an average of 3.3 members, compared to 2.9 in food secure households.
The prevalence of food insecurity among children in the Greater Washington area is significant: 10%, equating to 103,000 food insecure children across the region.


Key Drivers of Trends
Given the fact that food insecurity is not an independent phenomenon, but rather a symptom of general financial insecurity, the CAFB-NORC survey includes several questions on household finances that help illuminate the driving forces behind food insecurity. One key question asked each year is whether households’ financial situations are staying the same, getting better, or getting worse compared to one year ago.
Among the food insecure population in Greater Washington region, 55% say their household’s financial situation has gotten worse since last year. Looking at the general population by income level, this statistic climbs higher as household incomes fall lower, meaning low-income households’ finances are deteriorating at much higher rates than middle- and high-income households.
55% of food insecure people say their household’s financial situation has gotten worse since last year.
This question was also asked in the 2023 CAFB-NORC survey, and the largest increases in respondents who said their finances had gotten much or somewhat worse occurred in the middle-income households, between the 41st and 70th percentile. This aligns with the sharp increases in food insecurity over 2023 rates in those middle-income deciles.
Change in financial situation since 2023 by household income level
Question: In the last 12 months, since May of last year, has your household’s financial situation gotten better, worse, or stayed the same?
Source: Capital Area Food Bank Survey conducted May 28-July 31, 2024 with 3,819 adults age 18 and older in the D.C. Metro Area
Based on the survey findings, a combination of forces is causing these dramatic declines in financial health and tipping more people into the status of food insecurity in 2024. Three of the largest factors are inflation, ongoing employment hardships, and the reduced levels of government benefits.
As the cost of living has continued to climb over the last four years, average wages have struggled to keep up, and government benefits were temporarily boosted but later reverted to lower levels of support. Particularly after March 2023, when SNAP Emergency Allotments ended, many households were left fully exposed to the effects of inflation with less income – earned or supplemental – to buffer them. Even for those not relying on SNAP to cover part of their food costs, the difference in growth rates between income and expenses is increasing pressure on many household budgets.
Cumulative growth in inflation, wages, and SNAP benefits
Sources: (1) US Bureau of Labor Statistics, Consumer Price Index for All Urban Consumers, Not Seasonally Adjusted in Washington D.C. MSA; (2) Federal Reserve Bank of St. Louis, Average Hourly Earnings of All Employees: Total Private in Washington D.C. MSA; (3) US Department of Agriculture, SNAP Data Tables, National Average Monthly Benefit per Person
The cumulative impact of these factors is that many households across our region have less financial margin than ever. For people experiencing the weight of higher costs for life essentials, reduced buying power, and the disappearance of many government supports – often all at once – the resulting imbalance in the budget means that food is very often one of the items to eliminated.
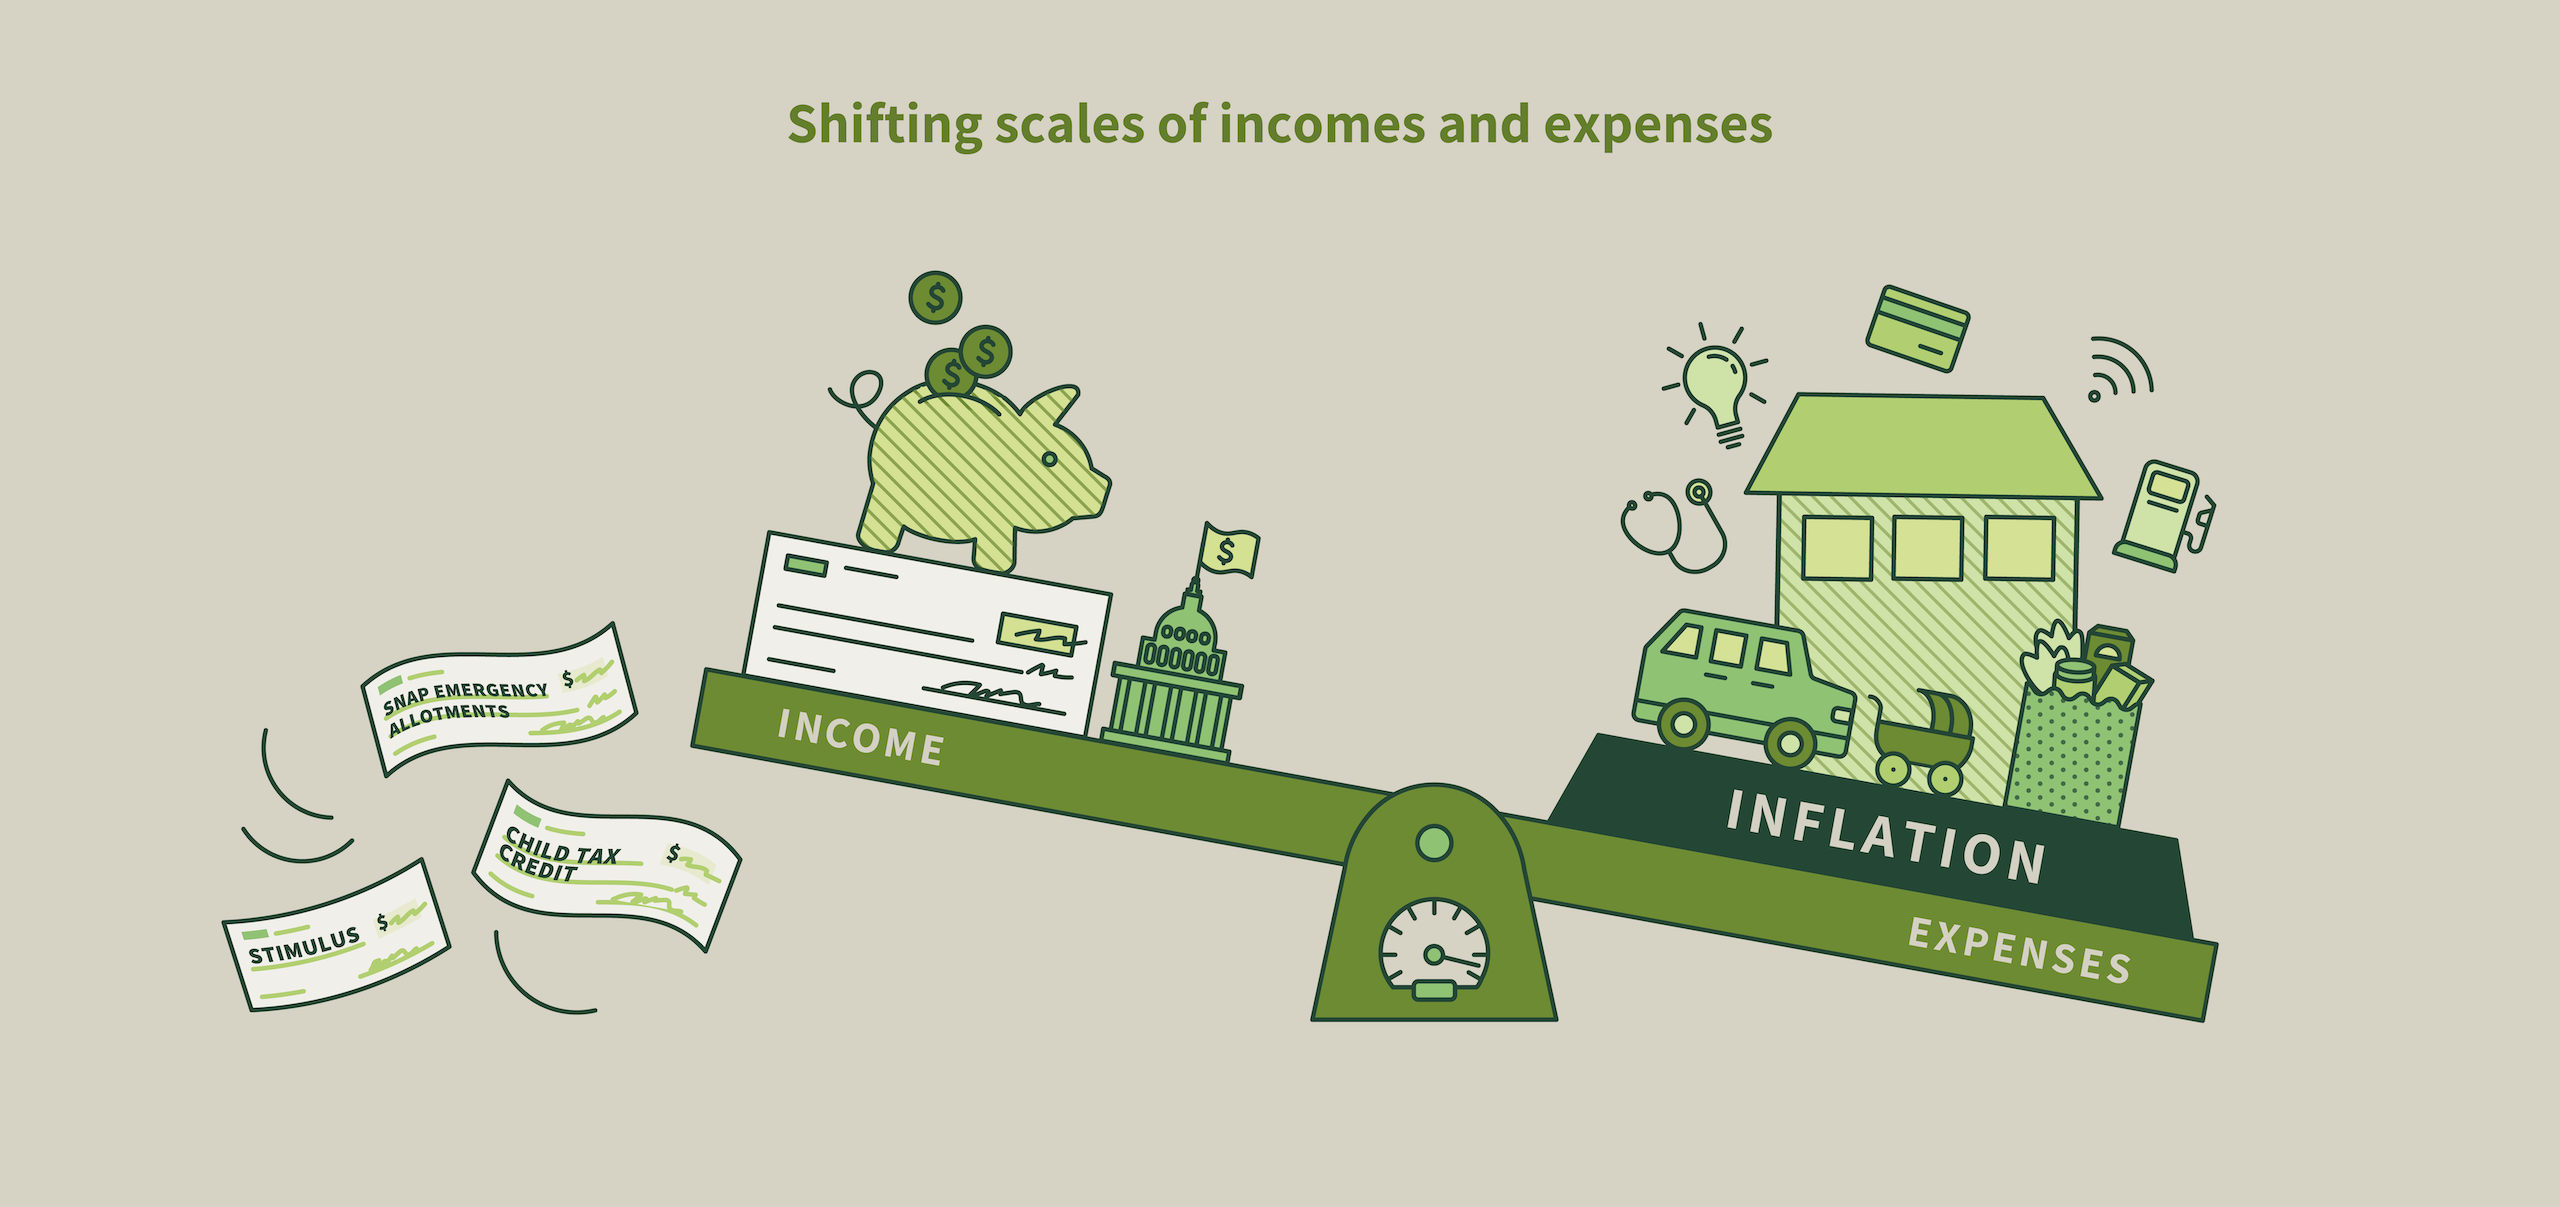
The following section explores each of these three dynamics – inflation, employment, and government benefits – and their impact on food insecurity in Greater Washington.
Protracted impacts of inflation
Overall rates of inflation have slowed significantly in recent months, with the national rate for May 2024 (the month that CAFB’s survey was fielded) at 3.3% – down from a the near-historic level of 9.1% in June of 2022.
However, while prices for goods and services are not continuing to climb at the same rapid rates, they are still markedly higher than four years ago. From May 2020 – May 2024, CPI in the Washington DC Metro Area has increased 18.8% total or 4.4% per year. The cumulative impact of this inflation has been burdensome for households struggling to make ends meet.
Higher food prices resulting from inflation have made it more difficult for Tamicka and her husband to afford the nutritious food that they need.
Survey results pointed to multiple categories of essential living expenses where ongoing higher costs had significant impacts on respondents’ budgets. These included food, housing, and certain other goods and services, such as childcare. The following sections explore how costs in these areas, which factor prominently into the budgets of many households across our region, have been impacted by inflation.
Food
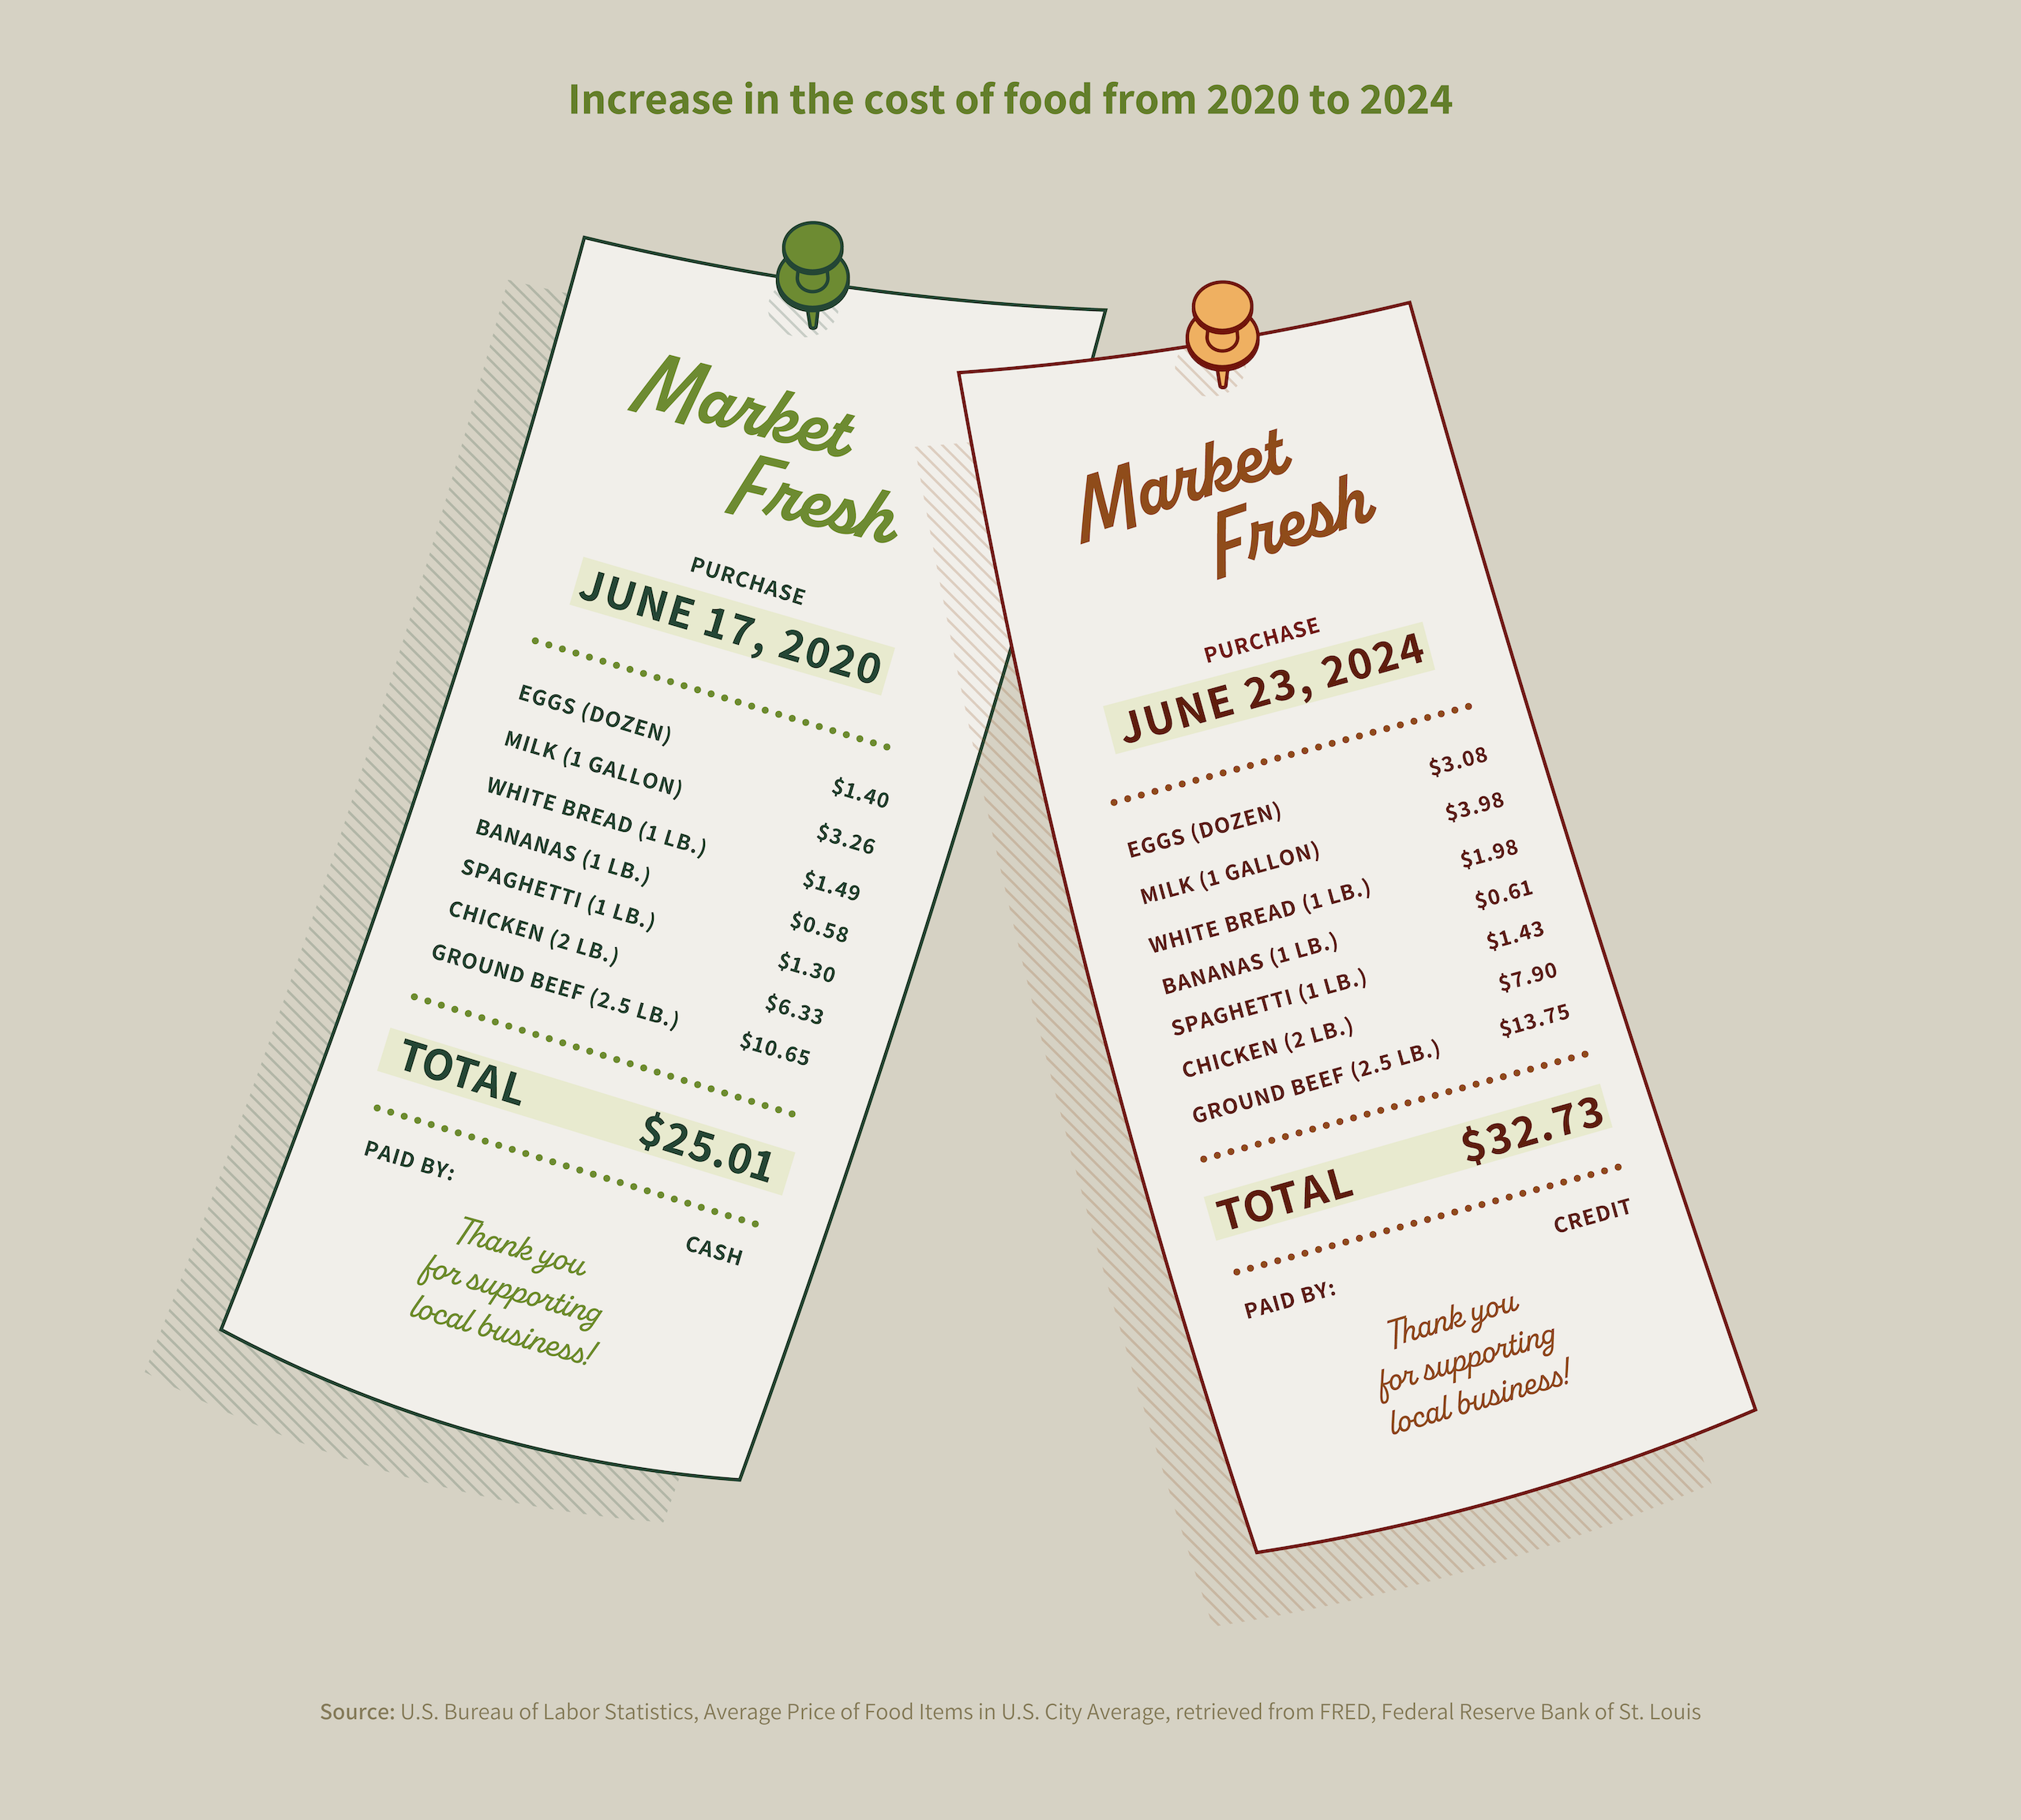
Most people visiting a grocery store in recent years have experienced higher costs at check out. The CPI for food has largely matched overall CPI growth, rising by 22.6% total or 5.7% per year between May of 2020 and May of 2024.
Overall, 64% of DMV residents reported that higher costs for food have had a major impact on their finances, up from 52% the year prior.
According to this year’s survey results, this ongoing increase in food costs is having a larger impact on household finances than any other category of inflation and is affecting more people than last year. Overall, 64% of DMV residents reported that higher costs for food have had a major impact on their finances, up from 52% the year prior. Even among food secure individuals, 50% of people cited higher food prices as having a major financial impact. For those experiencing food insecurity, however, that number was 88%.
Housing
Housing, which tends to be the largest expense for the average American consumer has also seen sizeable increases over the last four years. The region’s CPI for housing rose by a total of 16.3% between May 2020 and May 2024 – 3.8% per year. These increases have been even steeper for renters, with average rent costs up 21% since May of 2020, according to the Zillow Observed Rent Index. Such price hikes disproportionately impact people in lower income households, who are more likely to rent a home and for whom housing costs takes up a larger share of overall income.
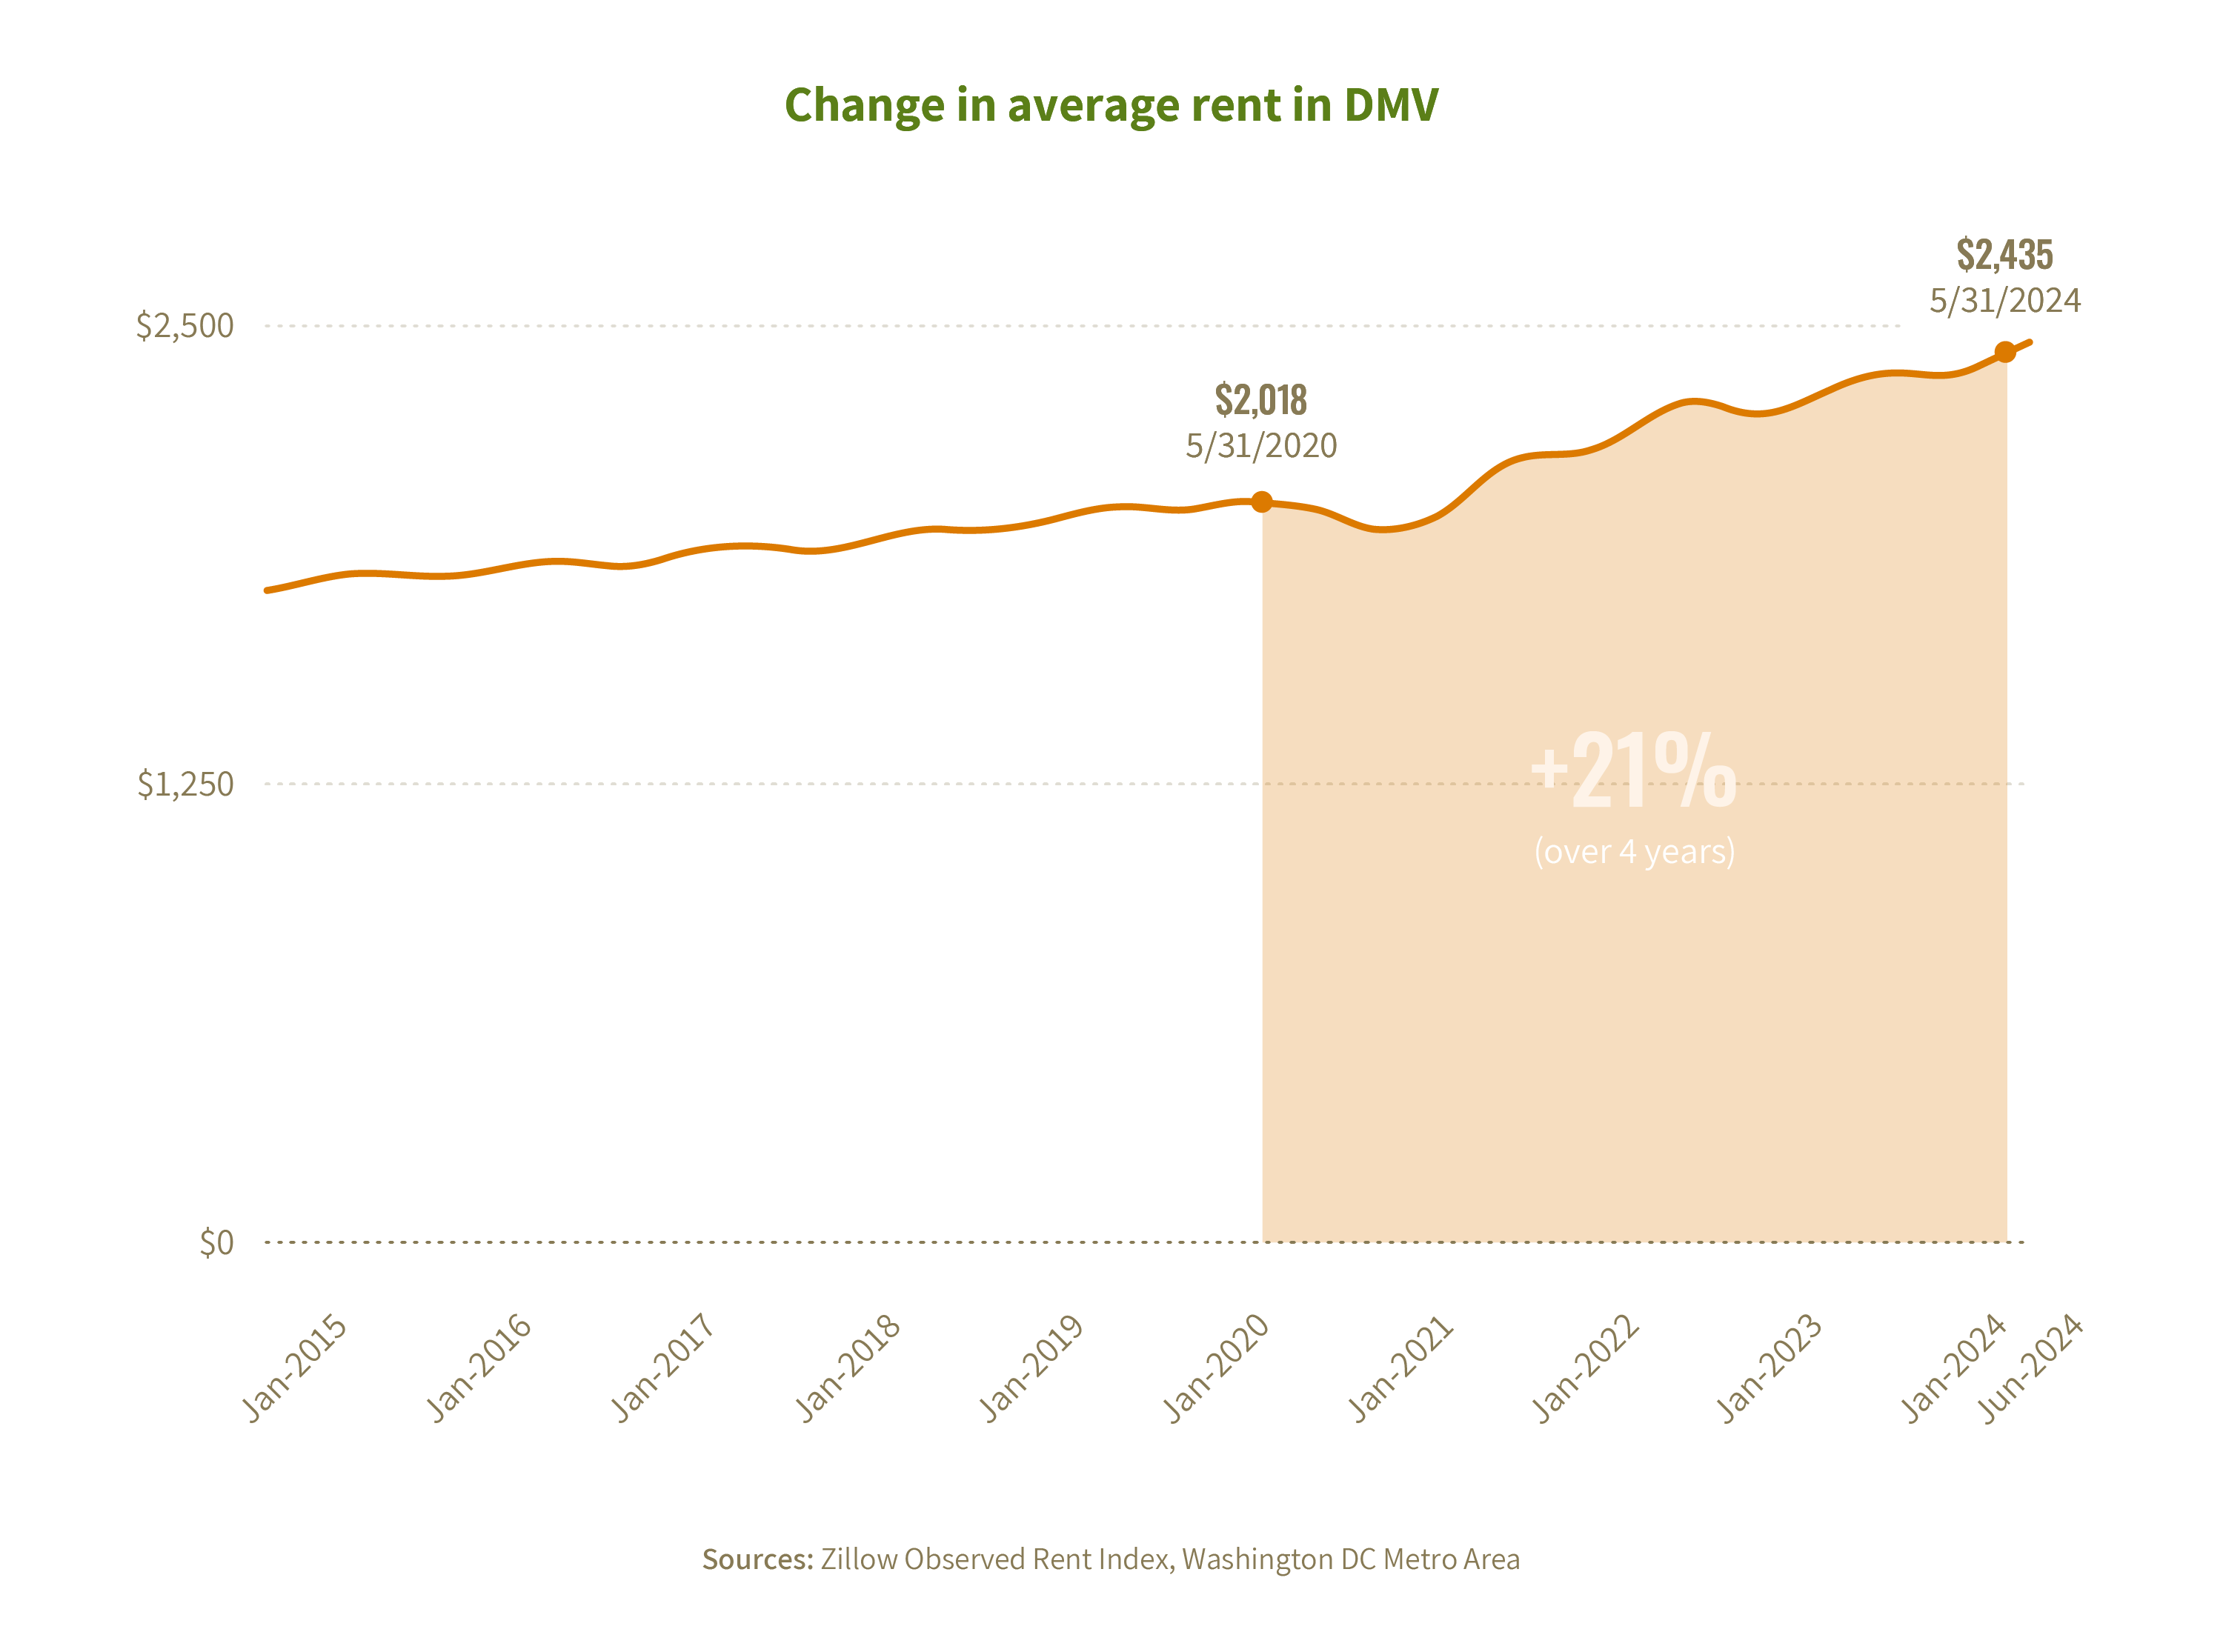
The effects of such increases have been wide-reaching. Among people surveyed, nearly half of all respondents – 46% – said that higher than usual prices for housing had a major impact on their household budget in the last year, up from 36% the year prior. And over half, 52%, cited increases in housing-adjacent costs for gas, water, and other utilities as having a major impact.
There is no affordable housing.
While such increases can impact the household budgets of people across the income spectrum, they particularly exacerbate the financial strain on those who are “housing cost burdened” – defined as spending over 30% of total income on rent. In the DC region, over 30% of residents in each county are considered burdened, making them more susceptible to financial shocks and stressors, less likely to be able to build emergency savings, and are more likely to have to make tradeoffs between things like housing, food, and medicine.
Due to the strain that housing burden places on household finances, it is highly correlated with food insecurity. Accordingly, 69% of the food insecure population said that higher than usual prices for housing had a major impact on their budget in the last year (versus just 32% of the food secure population). And 76% said that the cost of gas, water, and other housing-related utilities had a major impact (compared to 38% of those who were food secure).
Additionally, of the people who said their household finances had gotten worse in the past year, 45% cited a loss of housing or an increase in housing costs as a major reason. Among households with children, this number rose to 50%.
Childcare
Beyond food, housing, and utilities, many other types of expenses have seen increases that affect household budgets. Higher than usual prices for goods and services, for instance, were cited by 55% of survey respondents as having had a major impact on their finances over the past year. Among the food insecure population, that number rose to 80% (vs. 41% of people who were food secure).

The cost of childcare, for instance, was rising before the pandemic and has continued that trend in recent years, with the national average annual price of child care increasing by 23% between 2017 and 2023. The cost of childcare has accelerated especially quickly in recent years, rising 0.24% per month between 2021 and 2023, the fastest rate in over a decade.
Factoring the minimum standard for full-time childcare, families in Greater Washington spend over $15,000 per year per child – 12% of a basic budget. (See the next section of this report for more detail on a basic family budget.) In the District, however, childcare costs are currently among the highest in the country, with the cost of center-based care for one toddler averaging $24,396 per year. For a single parent earning the average personal income for the region, that constitutes 29% of their income.
Ongoing employment hardships
The second major driver of rising rates of food insecurity is ongoing challenges related to employment and wages. The 2024 CAFB-NORC study shows employment hardships are either staying steady or increasing relative to 2023. Loss of hours, wage cuts, and layoffs are still relatively common. Notably, they also follow distinct patterns by race, with the Hispanic population experiencing the most employment hardships.
Employment hardships in the last 12 months by race
Question: In the last 12 months, since May of last year, have you or has someone in your household experienced each of the following, or not?
Source: Capital Area Food Bank Survey conducted May 28–July 31, 2024 with 3,819 adults age 18 and older in the D.C. Metro Area
These findings help explain the increasing rates of food insecurity, including different rates of increase for different racial groups, but they also create tension with the many macroeconomic indicators making headlines in the last year that suggest the American labor economy is “back to normal” or even better.
This tension is not unique to our study. Despite these apparently positive trends, many people still feel very pessimistic about the economy broadly, including their own financial health. In fact, consumer sentiment has still not regained ground to its pre-pandemic levels. What is driving the disconnect?
The following section unpacks four labor market trends making headlines, taking a deeper dive into the real employment experiences of households at the lower end of the income spectrum.
Unpacking labor market trends
Trend #1: “Unemployment numbers are very low, in line with pre-pandemic levels.”
While this is true, unemployment levels don’t capture other dimensions of economic hardship, like wages relative to cost of living, part-time vs. full-time work, or those who’ve given up looking for work (who are excluded from that unemployment figure). Looking at an inverse measure of unemployment – employment – reveals that employment in the DMV was still 14.6% lower than January 2020 at the time of the CAFB-NORC survey in 2024. That number is even lower (-24.0%) for employment in jobs paying less than the median wage.
Trend #2: “The current labor market is very tight, with record levels of job openings since 2021.”
While tight labor markets are viewed as a time of great opportunity for job seekers, the types of jobs currently available are not accessible to everyone. This is particularly true in Greater Washington, where, among the top 10 occupations listed in job openings, 8 are in computing, business, or management and regularly require a bachelor’s degree to qualify (Source: JobsEQ). As noted earlier, 29% of the food insecure population has a college degree or higher. For the rest who do not, or who have degrees in unrelated fields, these opportunities are present but out of reach.
Trend #3: “Wage growth has outpaced inflation for over a year now.”
The fact that wage growth is higher than inflation on a rolling 12-month basis masks the real impact of these forces on household budgets. Comparing cumulative inflation to cumulative wage growth since the start of the pandemic, wages are still not keeping up. As noted above, the CPI in the Washington DC Metro Area has increased 18.8% from May 2020 to the time of the CAFB-NORC survey (May 2024), but average wages in the DC Metro Area have only risen 7.5% in that same timeframe, or 1.8% per year. In terms of purchasing power, this means that someone making average earnings in our region today can buy 9.5% less with their wages than they did four years ago.
Cumulative change in buying power of median wage in DMV
Sources: (1) US Bureau of Labor Statistics, Consumer Price Index for All Urban Consumers, Not Seasonally Adjusted in Washington D.C. MSA; (2) Federal Reserve Bank of St. Louis, Average Hourly Earnings of All Employees: Total Private in Washington D.C. MSA
Furthermore, this assumes median wage growth. According to the CAFB-NORC study, only 29% of food insecure households saw any increases in their wages or salary last year, compared to 51% of food secure households. So, for many, the cost of living has continued to rise with zero growth in wages, leaving them exposed to the full force of inflation with no buffer.
In terms of purchasing power, this means that someone making average earnings in our region today can buy 9.5% less with their wages than they did four years ago.
Trend #4: “Wage growth has been highest at low wage levels for several years.”
While this is a positive and necessary trend for reducing income inequality, two issues limit the impact of this trend on low-wage workers. First, high growth rates on small numbers yield low increases. As evidence, despite this trend, low-wage jobs still don’t pay nearly enough to make ends meet in the DMV. Second, unfortunately this trend has stagnated, with growth rates converging across wage levels – a pattern which will exacerbate income inequality.
End of pandemic-era federal benefits
During the pandemic, the federal government made a series of unprecedented investments and temporary policy changes aimed at blunting some of COVID-19’s most severe economic impacts. These included, among many others, enhancements to food assistance programs, the creation of rental assistance programs, and investment in childcare supports. By the spring of 2023, when the pandemic health emergency officially ended, nearly all these programs had wound down or were in the process of sunsetting.

This year’s survey data, therefore, reflects an economic landscape that has been almost fully devoid of those supports for the past 12 months, even as the cumulative impacts of inflation have continued and wages have failed to keep pace.
Among people who said their household finances had worsened over the last year – 29% of people overall, and 40% of people with children – cited a loss or reduction of federal benefits as a factor in their worsening finances.
SNAP enhancements
One of the most significant nutrition program enhancements during the pandemic was the temporary increase of benefits provided through the Supplemental Nutrition Assistance Program (SNAP, formerly known as food stamps). After benefits were raised to the maximum allowable amount for all SNAP recipients in March of 2020, pandemic-era SNAP Emergency Allotments wound down three years later in March of 2023. The average reduction in the greater Washington area was $93 per individual and $173 per household, though many people experienced even steeper declines.
In last year’s survey data, collected about two months following the end of emergency allotments, seventy-five percent of SNAP recipients reported that the reductions to their benefits had a major negative impact on their finances. This year, respondents who receive SNAP (a program relied upon by 27% of those facing food insecurity in our region) have experienced a full year without that supplemental support, which amounted to a minimum of $1,116.
Pandemic rental assistance programs
To stave off the worst effects of the pandemic on renters and landlords, the federal government invested $46.55 billion in an Emergency Rental Assistance (ERA) program through 2021’s Consolidated Appropriations Act and subsequent American Rescue Plan. Administered by counties across the country, these funds provided essential support for those who were at risk of losing their homes. Those program funds were temporary in nature, however, and have since been exhausted.
Everything is more expensive, but there are fewer supports. It’s the perfect storm.
Today, many regional residents still owe back rent after falling behind during the pandemic, or are contending with rents that have risen significantly faster than their wages, as discussed earlier in this report. This has led to an uptick in demand for rental assistance even as far fewer funds are available, resulting in more individuals and families who are financially stretched and forced to choose between housing and other critical necessities like food and medical care.
Childcare
COVID-19 exacerbated several issues that the childcare sector had already been facing prior to the pandemic, including high demand for services, worker shortages, and escalating costs. By many analyst estimates, nearly 10% of the nation’s licensed childcare programs closed – either temporarily or permanently – in the first year of the pandemic. To help shore up this critical service, lawmakers supplied nearly $53 billion in federal aid. The infusion of funding proved wide-reaching and critical: 80% of childcare providers received it, and 92% of stabilization grant recipients said the funds helped them stay open.
That funding is now coming to a close. Multiple government grants for these programs expired as of September 30, 2023, and remaining funds will go away on September 30, 2024. While the exact impacts on funding expiration are still being calculated, preliminary analysis shows that childcare has become less available and more expensive since the first expiration of these funds.
Preliminary analysis shows that childcare has become less available and more expensive since the first expiration of these funds.
Moreover, projections indicate that up to three million children could lose access to childcare nationwide as a result of these funds expiring, and seventy-thousand child care programs are likely to close. All of this has put continued financial strain on people across the economic spectrum, with particularly harsh impacts for those who are already under financial duress.


Choices Faced by People Experiencing Food Insecurity
While food insecurity is a defined term with specific criteria, it is also an experience – one that is lived out by thousands of people across our region every day. That experience often involves difficult choices and harsh trade-offs that can take a heavy physical, mental, and emotional toll. When exploring strategies to address this issue, understanding these lived experiences – the kitchen table conversations about money, the trade-offs between different necessities, and the choices made about what, how much, and sometimes whether to eat – is as important as understanding the underlying economic and social forces at play.
The following section draws from numerous studies, including this year’s CAFB-NORC study, to help paint a picture of the budgets and experiences of people facing food insecurity across our region.
The finances around the kitchen table
For food insecure households in Greater Washington, keeping up with monthly expenses is a constant struggle. This is no surprise, given the basic household budget for a family of four in this region requires between $114,000 and $135,000 in annual income, depending on which economic study is being consulted.
For food insecure households in Greater Washington, keeping up with monthly expenses is a constant struggle.
Factoring the costs of covering a family’s basic needs where they live, experts from the Economic Policy Institute, MIT, and United Way have each calculated the minimum income that families of various sizes need to make ends meet in different geographies. Taking the average of the three studies and breaking it down to monthly expenses, it becomes clear why a typical family of four earning even median wages may be vulnerable to food insecurity.
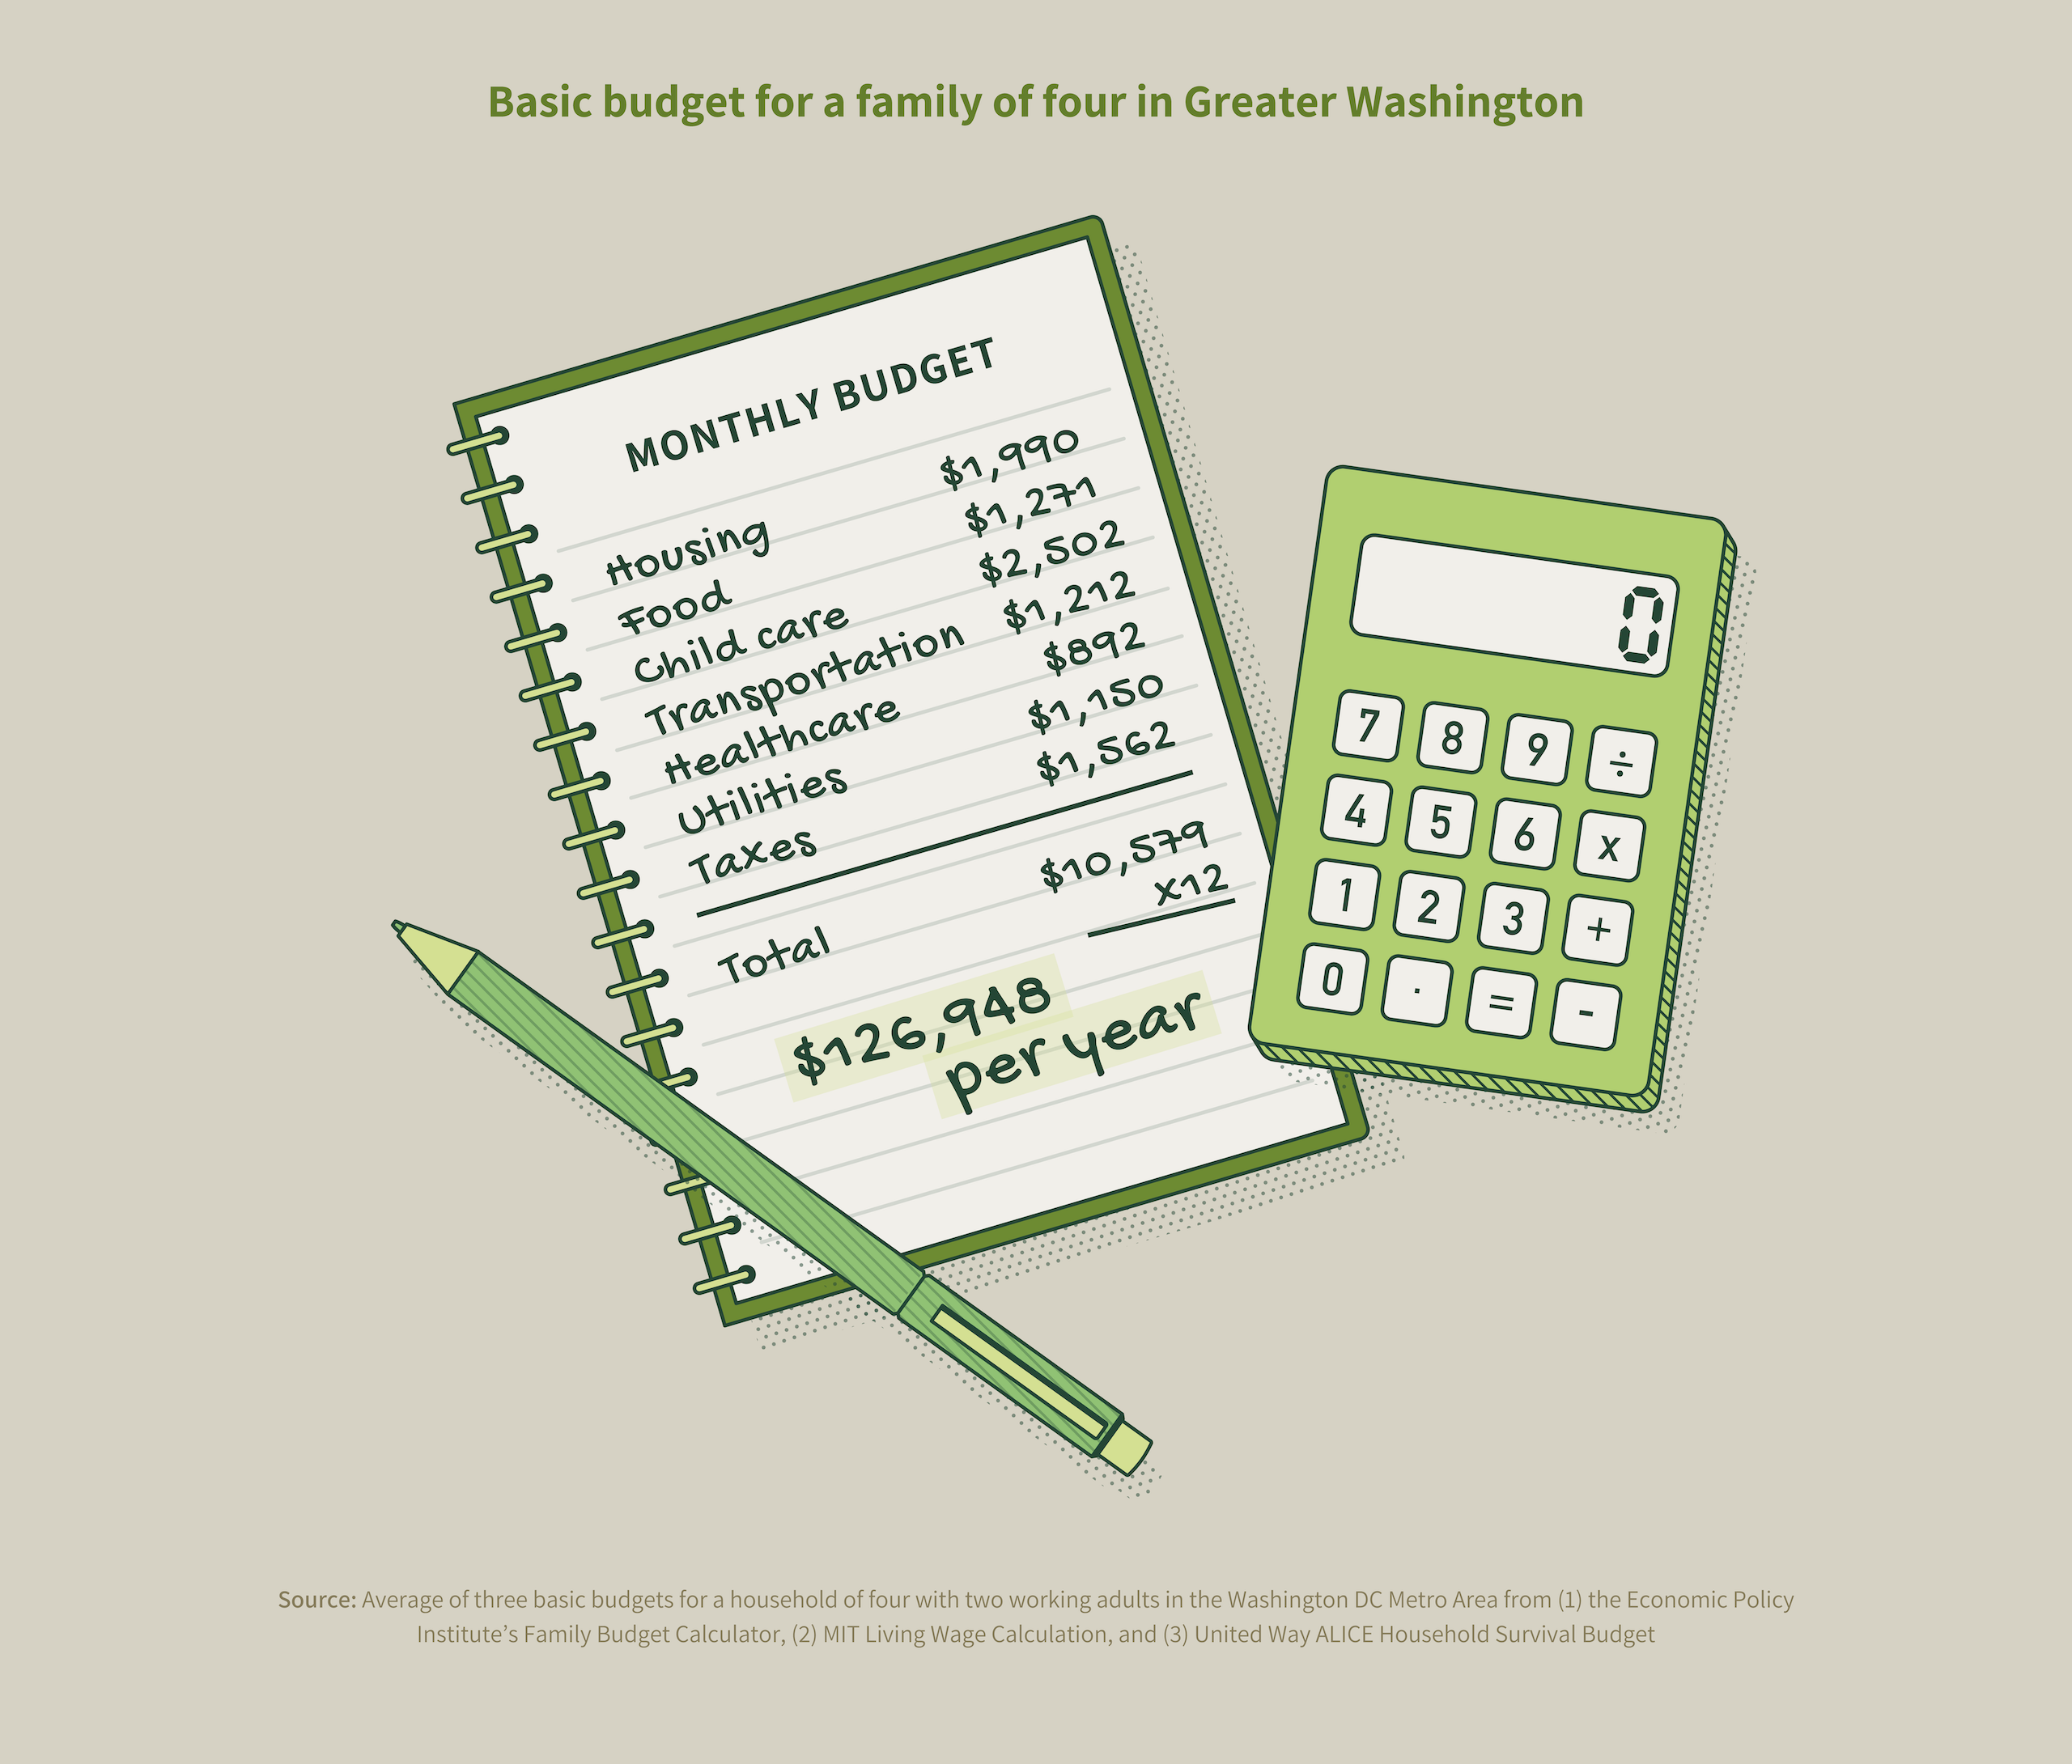
Zooming in on the food budget specifically, the average of these three expert studies suggests a minimum monthly food budget of $1,271. However, the CAFB-NORC study found that the average food insecure household with children is spending less than half that amount – only $544 per month – on food between their government benefits ($162) and their own earned income ($380). While charitable food providers are stepping in to fill in a portion of that gap for some food insecure households (only 46% access charitable food), the rest of it is going unaddressed, leading to poorer health and nutrition for thousands of families.
Choices about what and how much to eat
With overall buying power significantly reduced for many people across our region because of inflation, and a high regional cost of living, budgets are extremely tight for many. Food is frequently one of the areas where people first trim back to make ends meet, and doing so can mean making different kinds of choices about what to eat, how much to eat, and in some cases, who in the household eats and when. In this year’s survey, 46% of the region’s residents reported running short of money and trying to make their food budget stretch, describing a range of coping strategies for trying to bridge this gap in their budget.
How much to eat
For those without adequate money for food, eating less was among the primary coping strategies. Over 51% of people said they cut the size of their meals or skipped meals, and 39% said they experienced hunger but did not eat. Additionally, 61% of people reported eating less than they felt they should because there was not enough money for food. Perhaps most concerningly, 31% of people reported not eating for an entire day due to a lack of funds for food, and 28% of people reported losing weight for this reason.
What kinds of food to eat
Food quality and type is another decision point for individuals when they are faced with a budget gap. When describing the food in their household, 41% of all residents described having enough to eat, but not of the types of food they wanted to eat, indicating they may be making choices about quality, nutrition, type, or a combination of these factors.Having balanced meals was also a challenge for many, with 29% of people stating that they sometimes could not afford to eat balanced meals, and 12% saying this happened often.
It’s getting harder and harder to have access to healthy quality food because costs are just rising and rising.
Feeding children in the household
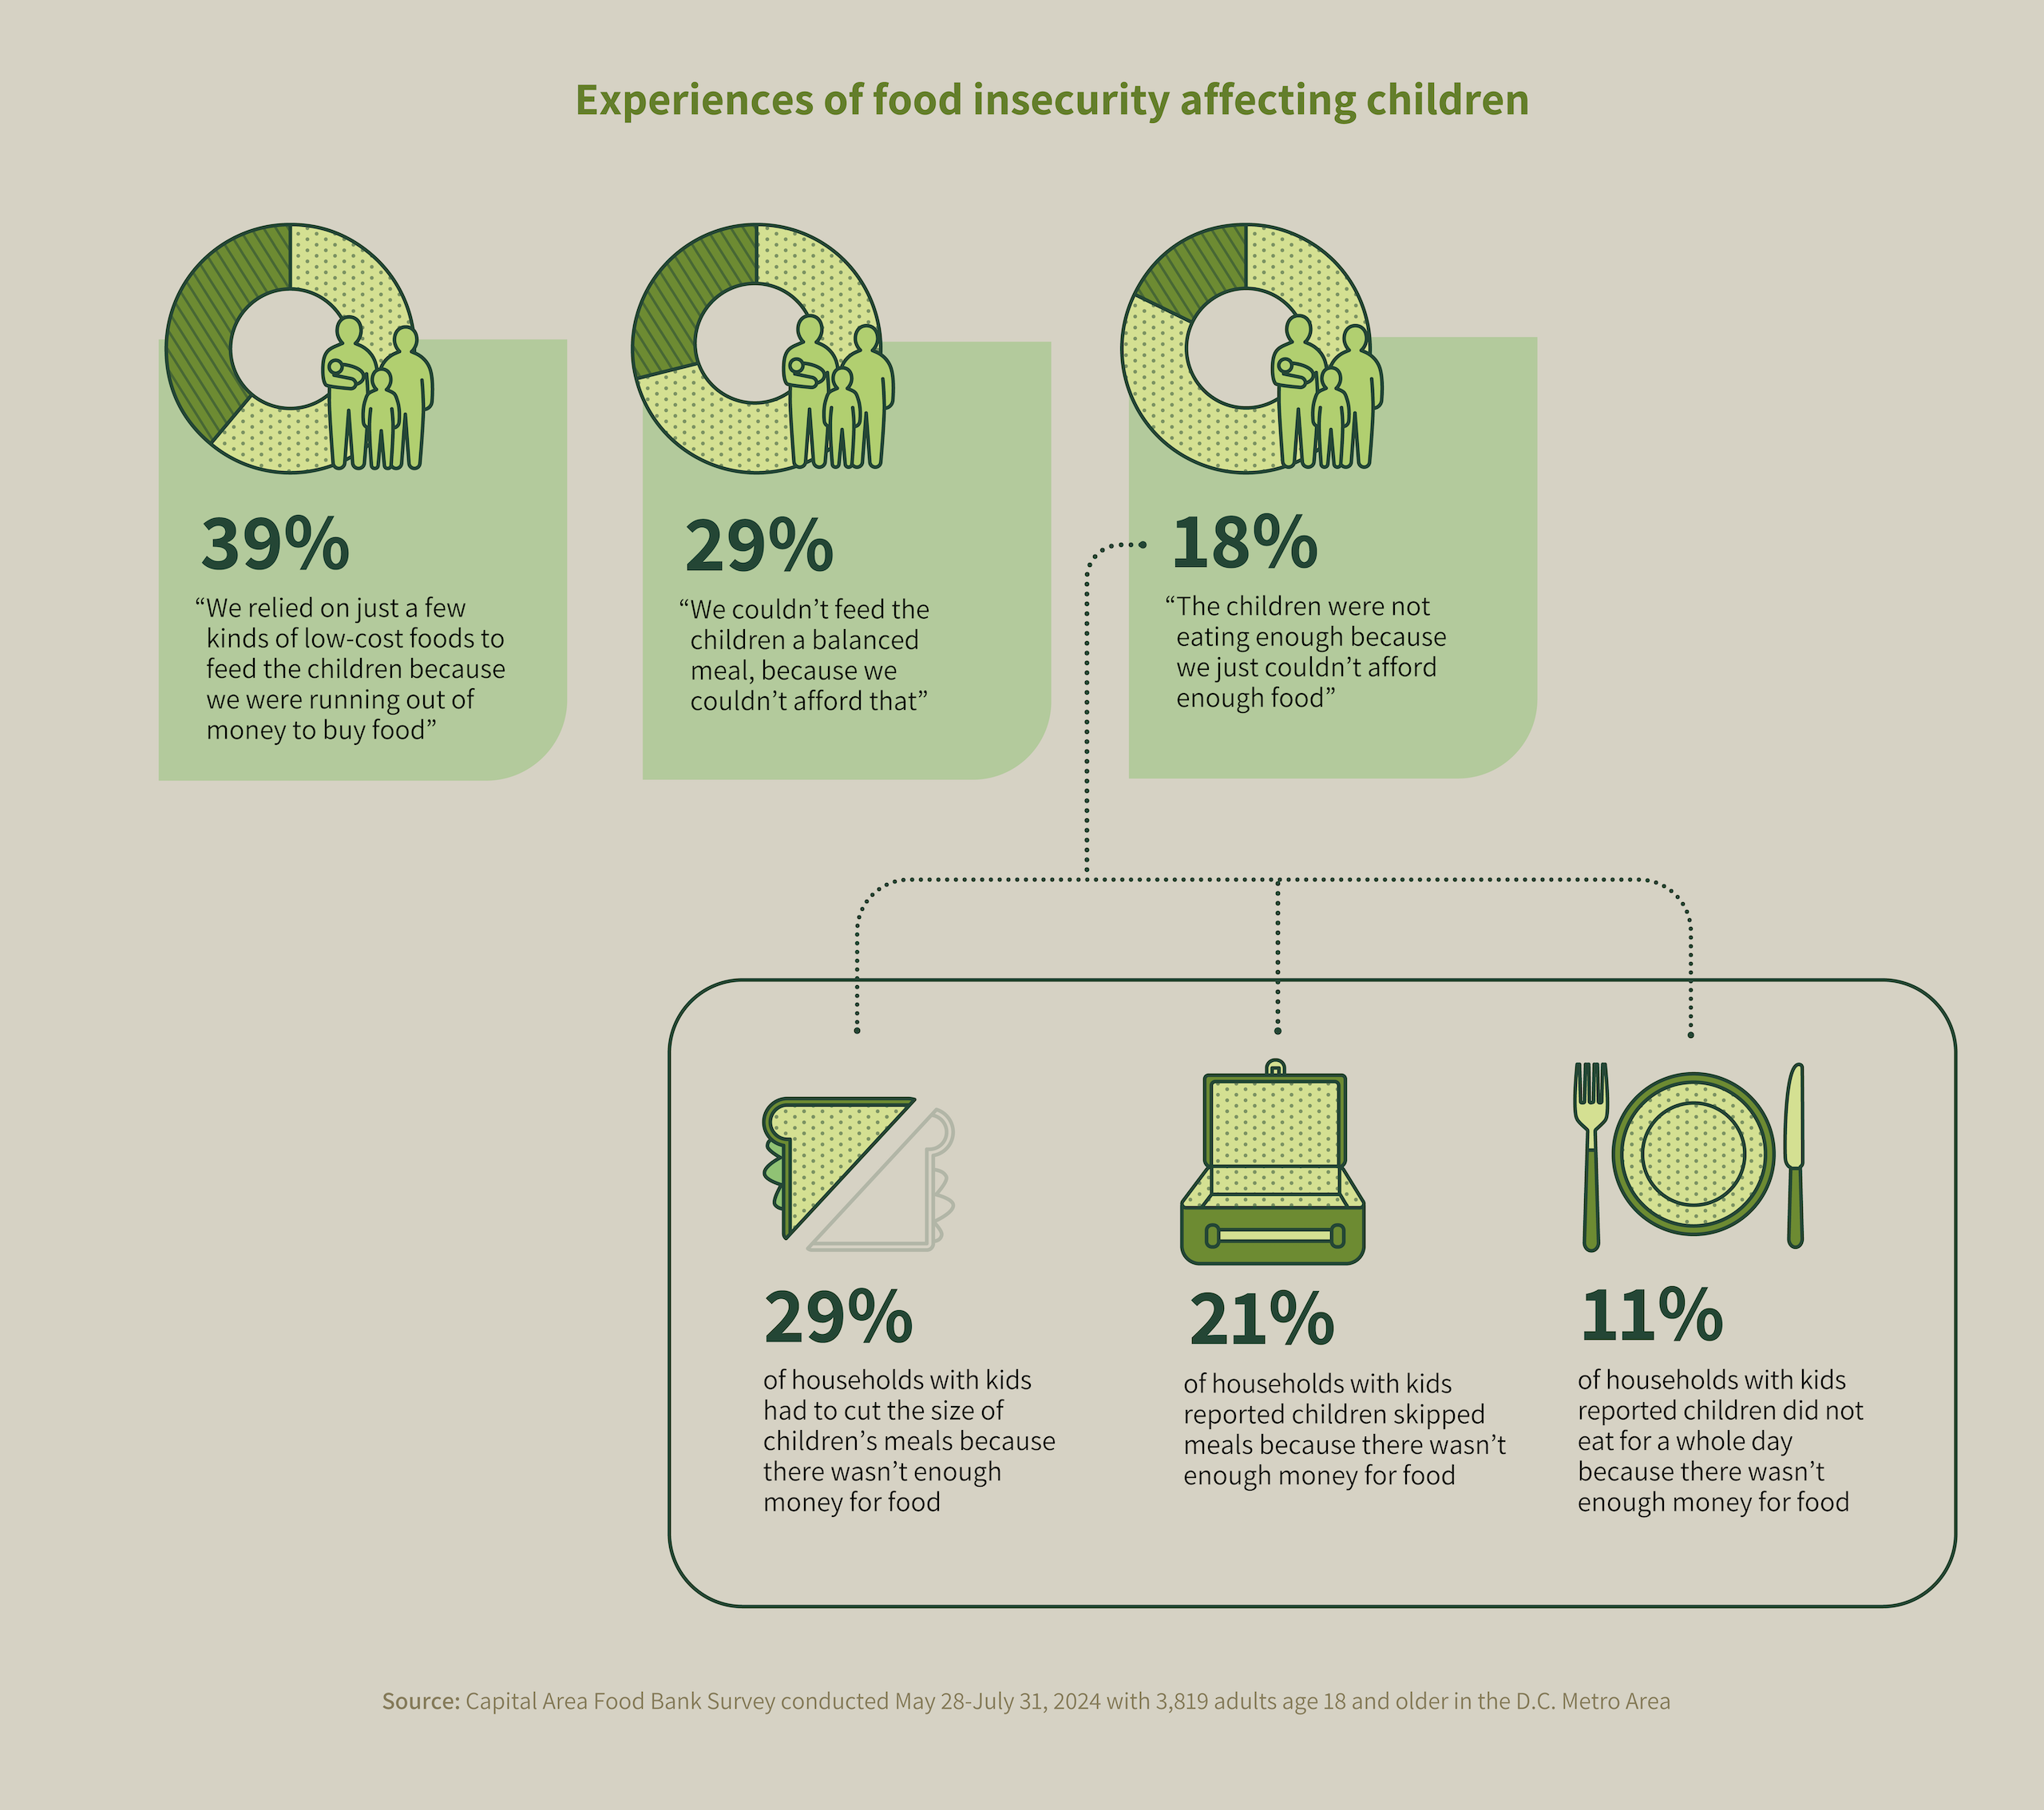
Coping strategies around trade-offs in food type and quality extended to how people reported feeding children in the household. Among all residents with children, 39% reported relying on just a few types of low-cost foods to provide to their kids, with 28% saying they relied on this strategy sometimes and 11% reporting that it happened often. And 25% shared that they sometimes could not provide a balanced meal for their children, with an additional 4% reporting that this happened frequently.
When it comes to children skipping meals, research in past hunger reports has indicated that adults will generally choose to forego eating their own meals so that children in their households have enough food. However, in some cases respondents shared that they simply could not make ends meet. Over 14% reported that their children sometimes were not eating enough because there wasn’t adequate money, and 4% more reported that this occurred often.
Trade-offs between food and other necessities
In addition to the difficult decisions about food that individuals must make for themselves and their families when resources are scarce (how much and what types to eat), many people must also make choices between food and other necessities because the household budget simply won’t cover both. These include essentials like rent, transportation, childcare, and medical care.
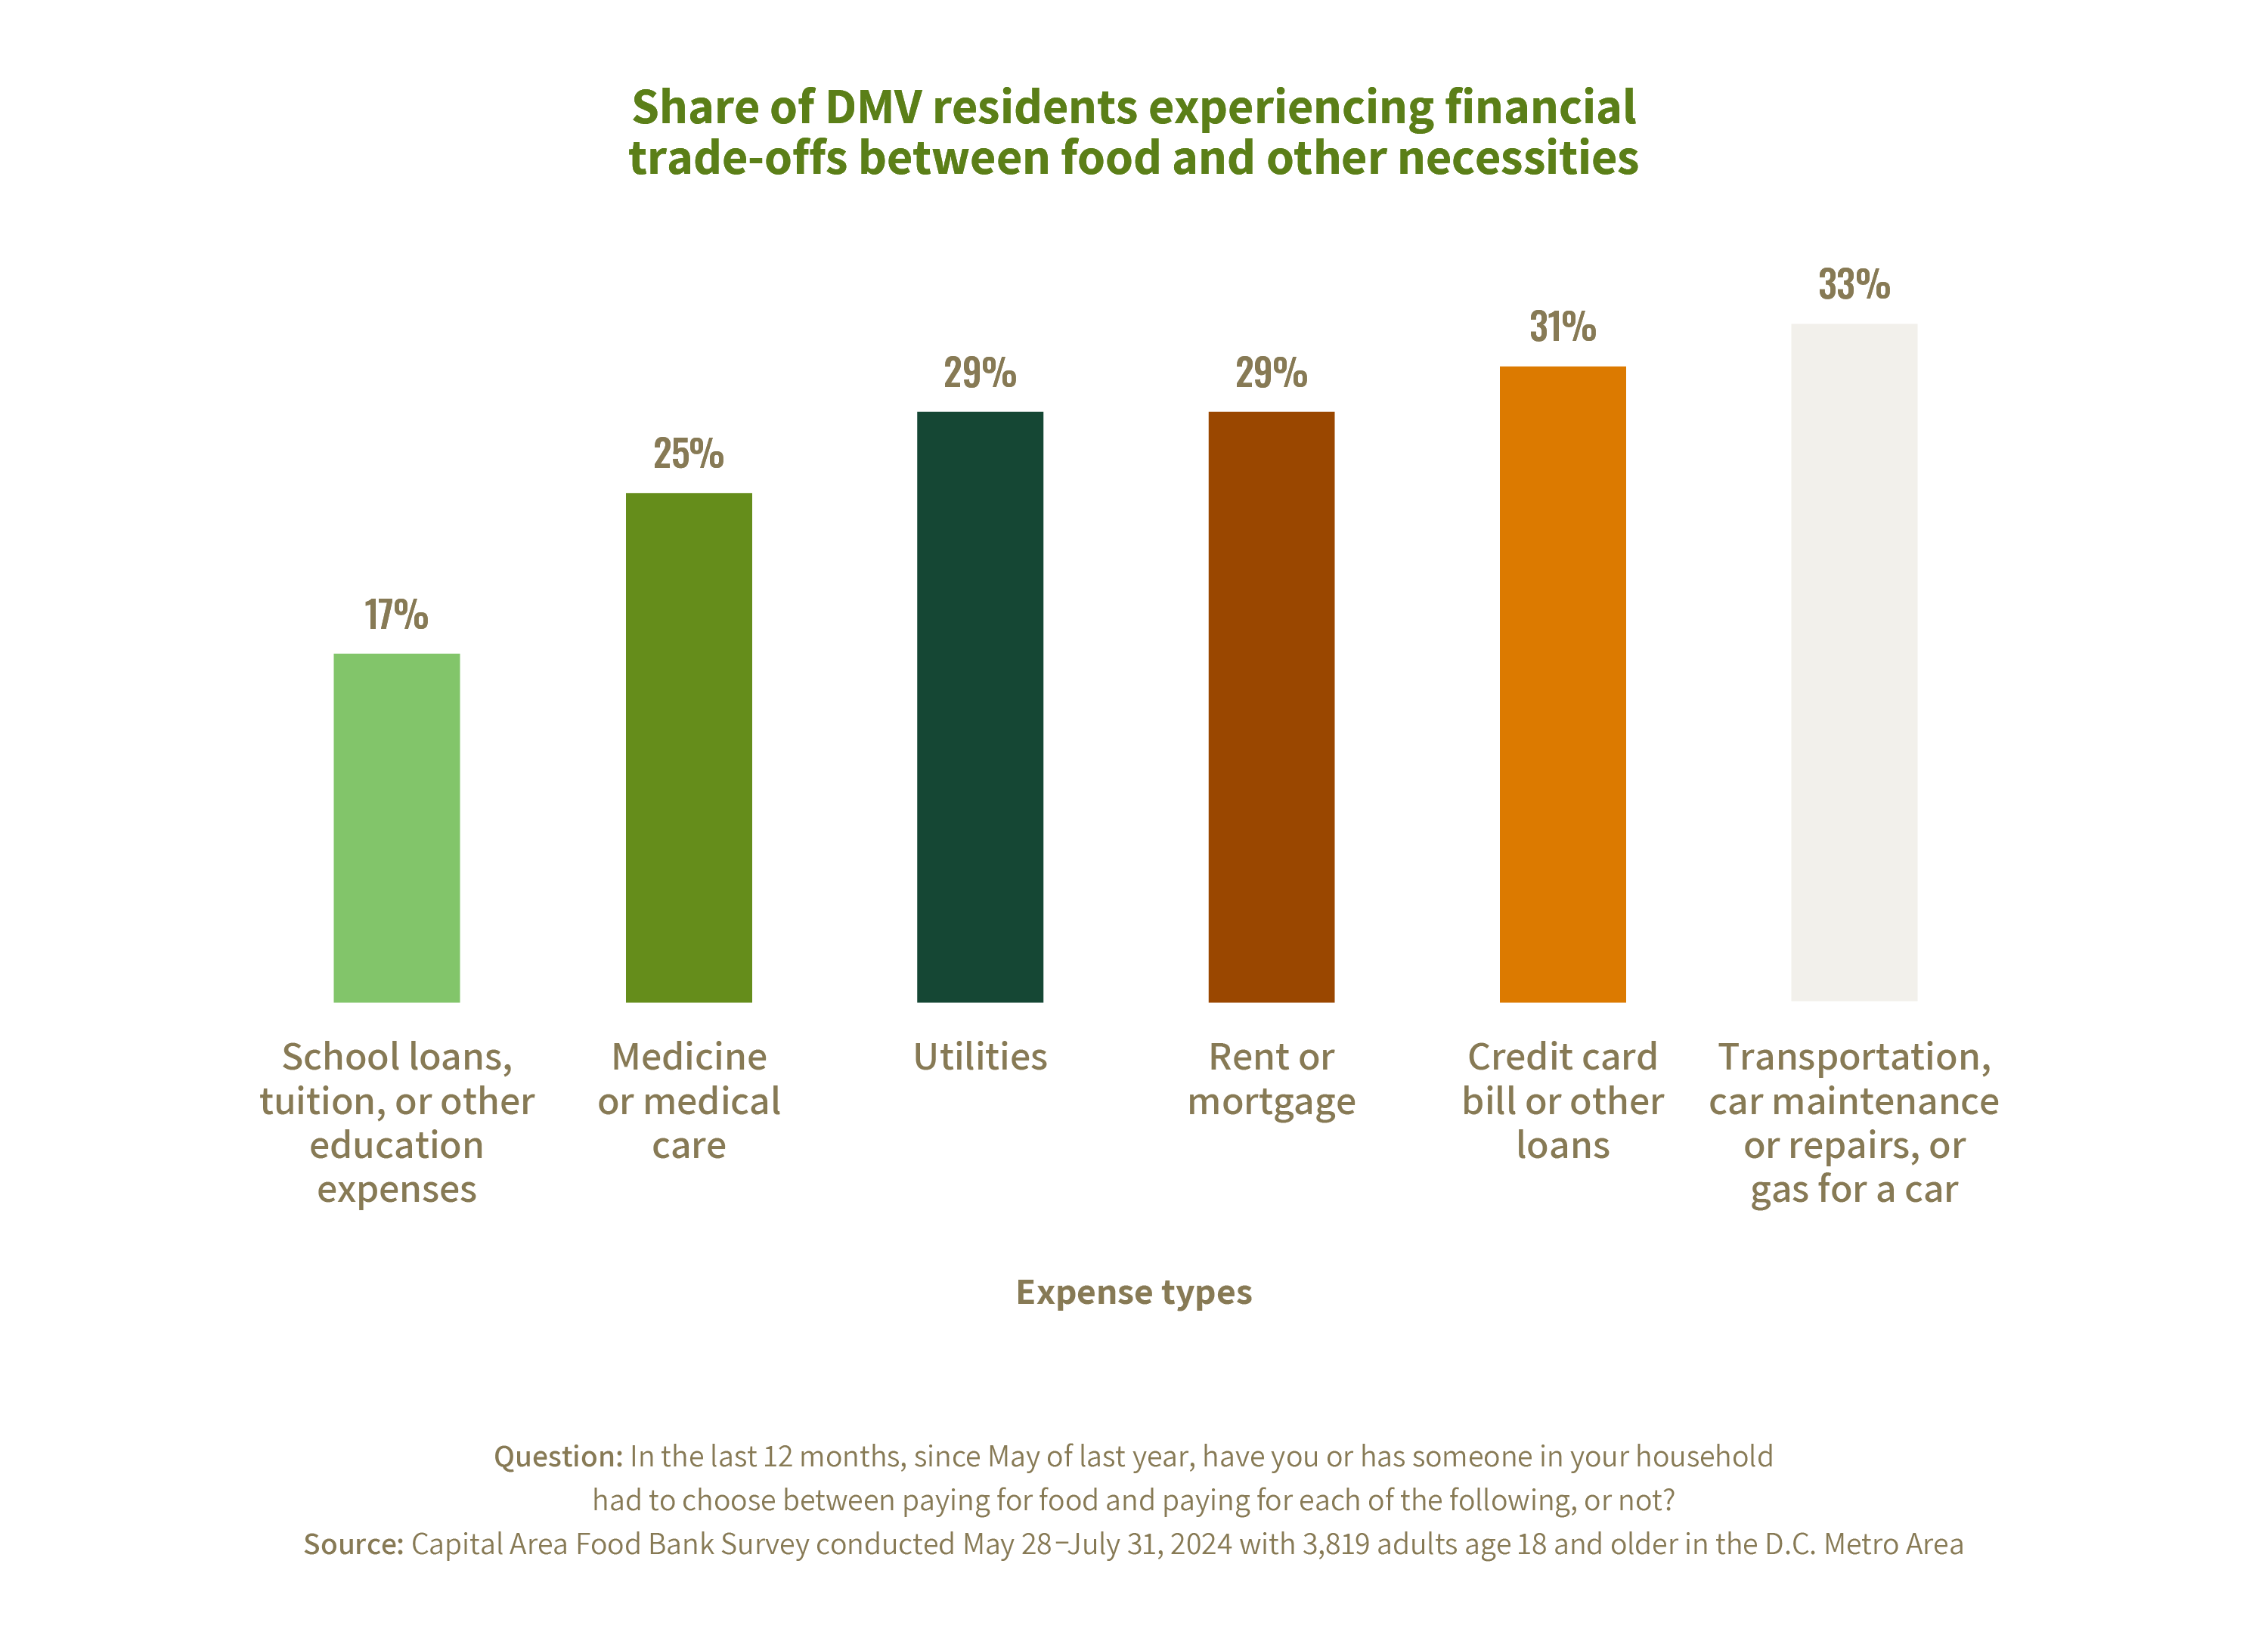
These trade-offs can have significant consequences. Delaying or not seeking needed medical care, for instance, can create health problems in both the short and long term. And those problems may be exacerbated by necessary choices between eating food that is nutritious versus food that is affordable – or eating enough food at all. Such difficult decisions may lead to diet-related disease, compounding the existing challenges of food insecurity.
Juana’s family has faced difficult financial tradeoffs, including buying less food so they can pay their rent and foregoing health insurance due to the high cost.
Trade-offs with credit card and loan payments can also have long term consequences. Missed rent, mortgage, or other payments can jeopardize access to essential utilities, goods, or services in the short term, and can cause mounting debt and credit issues in the future that jeopardize good financial standing and the ability to build wealth. This threat to financial health is increasingly common, as the percentage of people with delinquent credit card debt, especially at lower income levels, has been rising rapidly since 2020.
Perhaps surprisingly, these trade-offs are being made by an increasingly wide swath of the income spectrum. While those with low incomes were making these difficult trade-offs at the highest rates, a significant and growing number of middle-income earners were also facing decisions between food and other necessities.
Share of DMV residents experiencing financial trade-offs between food and other necessities by income level
Question: In the last 12 months, since May of last year, have you or has someone in your household had to choose between paying for food and paying for each of the following, or not?
Source: Capital Area Food Bank Survey conducted May 28-July 31, 2024 with 3,819 adults age 18 and older in the D.C. Metro Area
These choices speak to the increasing financial vulnerability of people at multiple income levels. If individuals and families are trading off between necessities, we can be sure that they are not prepared to absorb bigger financial shocks or unplanned expenses, such as an unforeseen medical bill or an emergency car repair.


Recommendations for Addressing Food Insecurity
When people in our community lack access to enough nutritious food, the impacts do not stop at the individual. Food insecurity is a problem that reverberates across the whole of our region, and which has downstream implications for all sectors and, ultimately, all residents in our area. Approaches for addressing this challenge must therefore be similarly far-reaching and holistic. Importantly, they must also be complementary and integrated. No single actor can solve this challenge alone, and lasting change will require thoughtful collaboration, both within and across public, private, and nonprofit entities.
The below recommendations for addressing food insecurity include strategies that encompass each of those categories. Some have been discussed in prior reports and are covered again here to underscore the consistency of the issues underlying this problem and the importance of approaching it from multiple angles. Combined, these recommendations have the potential to positively impact our neighbors both in the immediate term, and over the months and years to come.
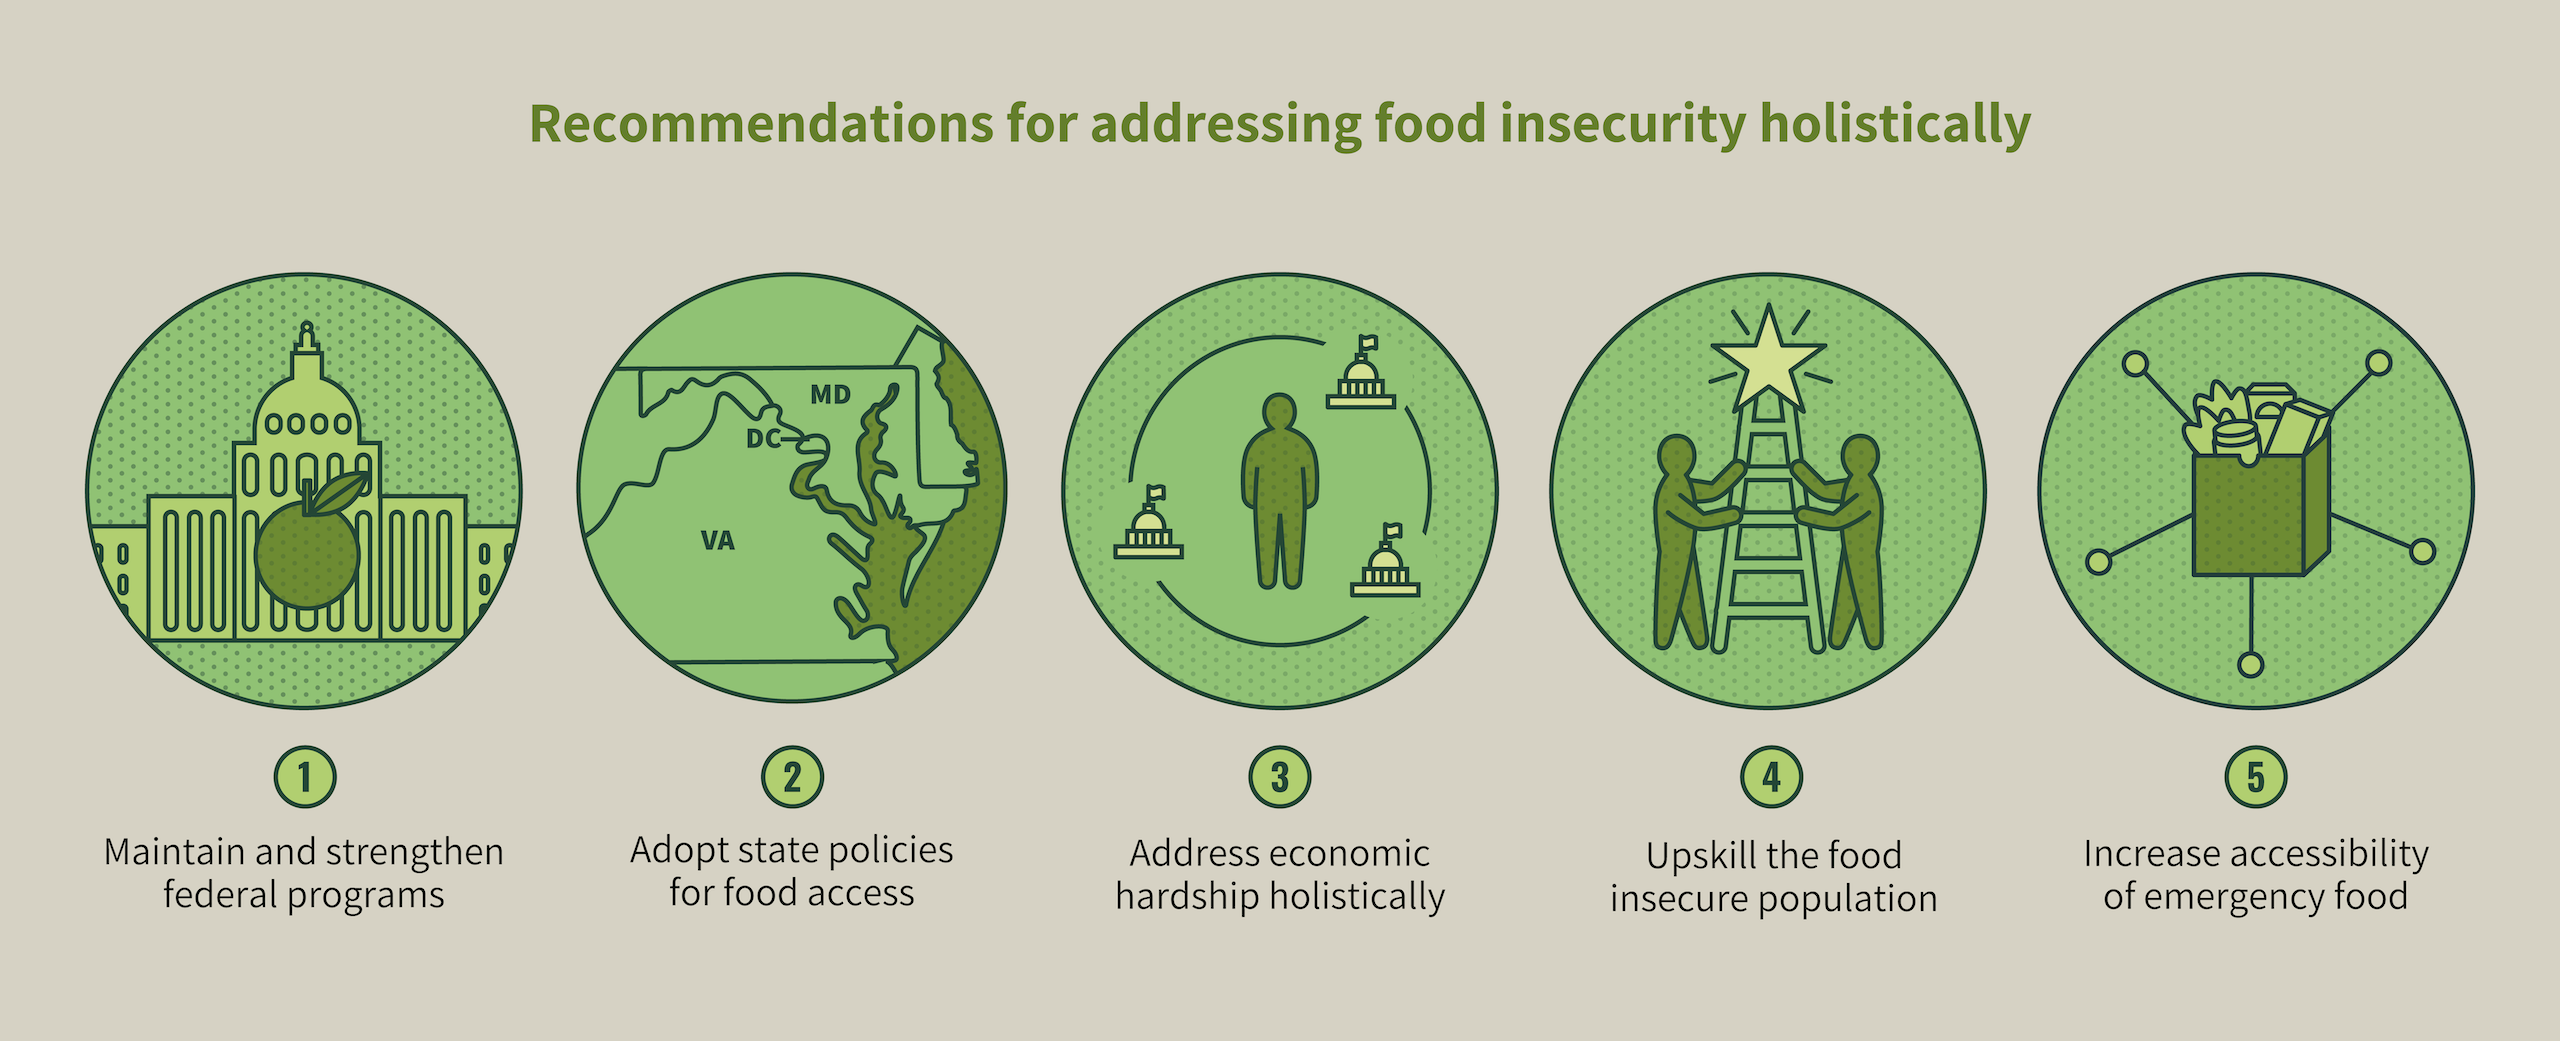
Maintain and strengthen federal programs that support food security
Government programs at every level remain one of the most effective ways to address – at unparalleled scale – food insecurity and the economic hardships that underlie it. These include initiatives that support food access directly through a variety of channels, as well as those focused on other aspects of economic security that impact a household’s ability to obtain enough nutritious food.

Federal nutrition programs play a front-line role in ensuring that people facing hunger get the nourishment they need today. With the number of individuals and families in our region who are struggling to put food on the table even higher than last year, the importance of maintaining and, where possible, strengthening these programs remains critical. And for the multiple federal nutrition programs funded through the Farm Bill – an expansive piece of legislation passed by Congress every five years that remains up for reauthorization this year – the opportunity to ensure that these supports remain strong is especially pronounced.
SNAP (Supplemental Nutrition Assistance Program)
SNAP helps people in need put food on their tables by providing benefits to purchase groceries. As the largest federal program aimed at addressing food insecurity, the scale of the SNAP program as a front-line resource for those facing hunger is unmatched: for every one meal that a food bank like CAFB provides, SNAP provides nine.
In our region, 27% of people facing food insecurity rely on this program. Its impacts on people’s budgets can be significant, especially when benefit levels that do not adequately support a household’s current level of need. During Farm Bill reauthorization, there are many opportunities to ensure the future strength of the program by:
27% of people facing food insecurity rely on the SNAP program.
- Ensuring SNAP’s purchasing power remains strong so that benefits align with grocery prices and provide adequate support during challenging economic times. This will enable SNAP participants to access the nutrition they need while also freeing up funds that allow them to invest in other critical necessities like housing and health care. More broadly, it will also decrease the need for charitable food assistance, helping to reduce strain on food banks.
- Streamlining SNAP eligibility and enrollment to improve access for older adults, college students, immigrants, and low-wage workers. Current eligibility rules and enrollment processes are complex, can preclude those in need from participating, and do not reflect the nature of our modern student population and workforce.
- Better assisting individuals seeking employment. Congress can help SNAP participants find work by supporting effective state employment and training programs and ensuring people receive adequate SNAP benefits while job searching.
TEFAP (The Emergency Food Assistance Program)
Having a consistent supply of nutritious foods for clients is of paramount importance to all food banks, and government commodities distributed to the charitable sector through The Emergency Food Assistance Program (TEFAP) have long played an important role in enabling that ability.

Through TEFAP, the US Dept. of Agriculture (USDA) purchases over 120 foods, including fruits and vegetables, eggs, meat, poultry, fish, nuts, dairy, and whole grains —from US growers and producers. Food banks, and other food-distributing organizations, then partner with states to distribute this food to people in need. This food is a critical part of food bank donation streams: over 20% of the food distributed through Feeding America network food banks and local hunger-relief programs comes from TEFAP.
This essential program could be made even stronger through refinements that create a better experience for individuals receiving support, as well as for food banks administering the program and the distribution partners they work with. These include:
- Reducing barriers to access for clients. Income eligibility thresholds create barriers to accessing TEFAP for individuals who are making too much to qualify for the program yet struggle to make ends meet in areas with a very high cost of living. Administrators at both the federal and state levels should remove or loosen these thresholds.
- Doubling the annual amount of funding for TEFAP entitlement commodities. The new level would ensure a steady flow of TEFAP foods to food programs like food banks and support the US agricultural economy.
- Providing sufficient funding to cover the program’s administrative costs. Lawmakers should create mechanisms to fund administrative costs, as well as other programmatic costs that do not currently cover the expenses associated with running the program.
- Diversifying commodity food offerings. Policymakers should allow food banks greater autonomy over food selection, as the foods provided frequently do not meet the cultural or health needs of the community members they serve.
CSFP (Commodity Supplemental Food Program)
CSFP provides monthly supplemental groceries for seniors. For participants in the program, CSFP not only provides an important source of nourishment; it also helps to address many of the health conditions often found in seniors who experience food insecurity. Contents of CSFP food boxes are tailored to the unique needs of older adults and contain nutrients that are often lacking in participants’ diets. Access to these nutritious foods can help seniors avoid costly hospitalizations and nursing home placements.
To strengthen this program, the federal government can reduce the administrative burden for program participants and increase program efficiency by streamlining reporting requirements.
Adopt state-level policies that expand food access
Programs enacted at the state level also play a significant role in expanding direct access to nutrition. States often have administrative latitude that can increase the flexibility and accessibility of many federal programs, and they can bring additional funding to bear that can enhance program efficacy and reach. In instances where federal funding no longer exists for certain initiatives, states can also create programs that fill in the gap. In the Washington region, there are opportunities for states and the District of Columbia to act in all these ways to establish or strengthen key nutrition programs.
Increase minimum SNAP benefits through state supplements
During the COVID-19 pandemic, SNAP benefits were raised to the maximum level allowable based on household size, a minimum of $95 per person. These increases, known as Emergency Allotments (or EAs), meant that no recipient household was receiving less than $95 in benefits per month, and many families received substantially more. Particularly for households that had been receiving minimal levels of benefits prior to this increase, these enhancements offered a meaningful jump in support.
During the COVID-19 pandemic, SNAP benefits were raised to the maximum level allowable based on household size, a minimum of $95 per person.
Following the rollback of EAs in March of 2023, some states have since moved to supplement the minimum monthly SNAP allotment. In New Jersey, for instance, state lawmakers increased the minimum benefit to $95 (up from a state minimum of $50 and a federal minimum of $23).
Locally, lawmakers have also explored state level benefits increases. In Maryland in this year, legislators passed an increase in the SNAP minimum for those who are 60 and older, elevating benefits for that population to $50 per month. In DC, through the “Give SNAP a Raise” initiative, all SNAP recipients received a temporary increase of up to 10% of their household’s federal maximum on top of what they already receive. However, these supplemental benefits, which began January 1, 2024, are set to expire on September 30, 2024.
States have the ability to provide critical additional support for a program that has been shown to significantly reduce hunger while increasing local economic activity. Maryland, Virginia, and DC should continue to pursue permanent additional funding to bring minimum benefits to more meaningful levels for people across our region.
Enact universal school meals
Expanding access to school meal programs has long been associated with a variety of positive outcomes for students, including improved attendance rates, greater capacity to stay focused in class, and higher standardized test scores and academic achievement. School meals were also a vital component of the national response to COVID-19. Throughout the pandemic, federal waivers allowed all students to receive free meals, including breakfast and lunch, at school.
When those national flexibilities ended in the summer of 2022, students and families were forced to revert to completing forms and navigating the administrative processes of demonstrating their eligibility. These processes can cause a burden for families with low literacy levels, those who do not speak English at home, and undocumented families. They can also create administrative burdens on school administrators who need to collect and analyze school meal applications. Requiring applications for school meals generally decreases overall participation in the program, especially for families and children who do not qualify for free or reduced-price meals but would benefit from them.
When those national flexibilities ended in the summer of 2022, students and families were forced to revert to completing forms and navigating the administrative processes of demonstrating their eligibility.
In the last year, Maryland and Virginia have both created working groups to study the costs of establishing universal school meals and to identify programs that could be leveraged to cover the costs. In DC, legislation has been introduced that would provide universal free school meals and after school snacks to public school, public charter school, and participating private school students. By moving to pass and fund universal meal programs over the coming year, states can ensure that all children receive the school day nutrition they need to focus and achieve.
Support the expansion of Food Is Medicine programs
Nearly half of the region’s food insecure individuals are experiencing at least one diet-related illness, and they are more than twice as likely to report having a chronic health condition that limits their daily activities compared to their food secure counterparts (29% vs. 13%) There is a clear need to expand and accelerate work being done to enable better health outcomes among this population, including programs like those run by the food bank that provide medically tailored groceries directly in clinical settings. Such programs are part of a broader body of initiatives known as “Food Is Medicine” (FIM) interventions.
While the positive impacts of FIM programs are evident, creating impact at a meaningful scale will ultimately require changing state and federal reimbursement structures to include FIM interventions as a covered benefit.
Nearly half of the region’s food insecure individuals are experiencing at least one diet-related illness, and they are more than twice as likely to report having a chronic health condition that limits their daily activities compared to their food secure counterparts.
Currently, funding Food Is Medicine programming requires action at the state level. Multiple states, including Massachusetts, Oregon, North Carolina, and Arkansas are using a mechanism in Medicaid known as a section 1115 waiver that allows them to use federal funds to test programs that wouldn’t normally be included under Medicaid. Increasingly, states are using the waivers to fund programs that address what are often referred to as “social determinants of health,” a category that includes a range of non-clinical factors like safe housing, water pollution, and access to healthy, nutritious food. Research has shown that these factors account for over 80% of health outcomes.
By pursuing these waivers for the purposes of funding innovative Food Is Medicine interventions, the governments of DC, MD, and VA can enable greater access to initiatives that are increasingly proven to help individuals improve their health, advance equity, and significantly curb the cost of healthcare by reducing diet-related illness. Seeking 1115 waivers to pilot the support of FIM services would also contribute to the case for national adoption of FIM programs as covered Medicaid benefits.
In the last year, DC has made progress towards expanding support for FIM programs by proposing to test the expansion of Medicaid coverage for nutrition services and supports when submitting its five-year renewal request for its 1115 Medicaid Demonstration Waiver in June of 2024. Proposed coverage, which could go into effect in 2026, could include interventions like produce prescriptions, medically tailored meals and groceries, and nutrition education. Maryland and Virginia now have an opportunity to follow suit by taking full advantage of the flexibility provided by the federal government. In Maryland, policymakers are currently considering nutrition supports in their own 1115 Waiver.
Invest in programs that enable food banks to source fresh local food
In December 2021, the USDA announced the creation of the Local Food Purchase Assistance Cooperative Agreement Program (LFPA) with the stated goal of improving domestic agriculture supply chain resiliency by strengthening local and regional food systems, expanding economic opportunities for local and socially disadvantaged farmers, and building partnerships that get fresh, nutritious food to underserved communities.
Since its inception, LFPA has helped to catalyze new relationships between buyers and growers, providing food banks with opportunities to partner with local food hubs and regional food system networks to purchase locally grown and raised products from farmers and producers they may have never previously purchased from. Through LFPA funding, for instance, the Capital Area Food Bank has been able to purchase and distribute over 1.5 million pounds of fresh local food since January of 2023. These foods include items like fruits, vegetables, dairy, and protein, and they were sourced from 33 local farmers and producers (up from 4 just a few years ago); 11 of those farms are small and minority-owned.
The LFPA program at the federal level is currently slated to wind down in June of 2025. States, therefore, have a significant opportunity to enable the continuation of this program in some capacity by continuing to invest in state-level programs like the Maryland Food and Agriculture Resiliency Mechanism program, and the Virginia Agriculture Food Assistance Program.
Support programs and policies that address economic hardship holistically
Nutrition programs are critical. But truly moving the needle on food insecurity will ultimately require that lawmakers create policies that more holistically address the multiple other factors impacting the overall economic stability of households in our region and across the country. These include areas such as:
Housing
Rising housing costs can be a significant driver in the overall financial instability of many households, forcing difficult tradeoffs between food and other parts of family budgets. Policy interventions proposed to address this issue range from caps on rent to increases in emergency rental assistance programs to funding mechanisms that incentivize the creation of additional housing. Collectively, such policy efforts could have a significant impact in both the short and long term on households across out region.
Policy interventions proposed to address this issue range from caps on rent to increases in emergency rental assistance programs to funding mechanisms that incentivize the creation of additional housing.
Childcare
Childcare has become increasingly expensive, taking up a significant share of the income of many working families and placing particular strain on the budgets of lower- and middle-income households. As with housing, policymakers have proposed a variety of mechanisms for assisting those who are burdened by childcare costs and strengthening the national childcare system overall. These include initiatives focused on things such as expansion of childcare financial assistance programs and subsidies; increasing state-funded prekindergarten programs; and growing investment in the early care and education workforce to increase the availability of care.
Locally, Virginia has sought to address the need for access to affordable childcare by investing over $1.1 billion in early care and education services for its current budget cycle.
Locally, Virginia has sought to address the need for access to affordable childcare by investing over $1.1 billion in early care and education services for its current budget cycle. Research indicates that in addition to positively impacting individual households, such investments also offer a strong economic return. Studies at the national level show that the gain in gross domestic product (GDP) from affordable child care could increase federal tax revenue by more than $70 billion annually.
Other income supports
Research has consistently shown that income-based tax credits are one of the most effective tools available for reducing poverty and food insecurity, increasing social mobility, and significantly improving long-term outcomes on health, education, and even employment.
Two commonly claimed tax credits—the Earned Income Tax Credit (EITC) and the Child Tax Credit (CTC)—were both expanded at various levels of government during the pandemic, and led to significant reductions in poverty in the US while they were active. While enhancements to the CTC and the EITC ended at the close of 2021, opportunities continue to exist for state governments to pick up where federal-level expansions left off. Maryland expanded both programs at the state level in 2023. And in the past year, DC included the District Child Tax Credit, which provides a fully refundable credit for each child of eligible parents who file taxes, in its FY25 budget. If grown and adopted across other parts of our region, these policies continue to have the potential to change the economic trajectory for thousands of additional people.
Invest in upskilling the food insecure population
Residents in the Washington DC metro area are experiencing a paradox of the current economy: Employers have said they are in severe need of talent, while hundreds of thousands of people are hurting for better jobs. The straightforward, win-win solution to this problem is to invest in upskilling the population earning under a living wage so they can take advantage of the opportunities for upward mobility that exist in this region.
However, workforce training alone cannot solve this challenge. Today, there are already hundreds of organizations in the region offering free or low-cost professional trainings that align with industry needs, and the attention and resources being dedicated to workforce development are growing. Yet many potential beneficiaries of these programs are either not enrolling or enrolling and not completing, because the financial stability required to complete even a short training program is out of reach.
The critical – and often missing – element for success of these programs is wraparound services that address adult learners’ basic needs (housing, food, transportation, childcare, etc.) while they are training for a better job, so they can maintain stability long enough to complete their programs and change their economic trajectory.
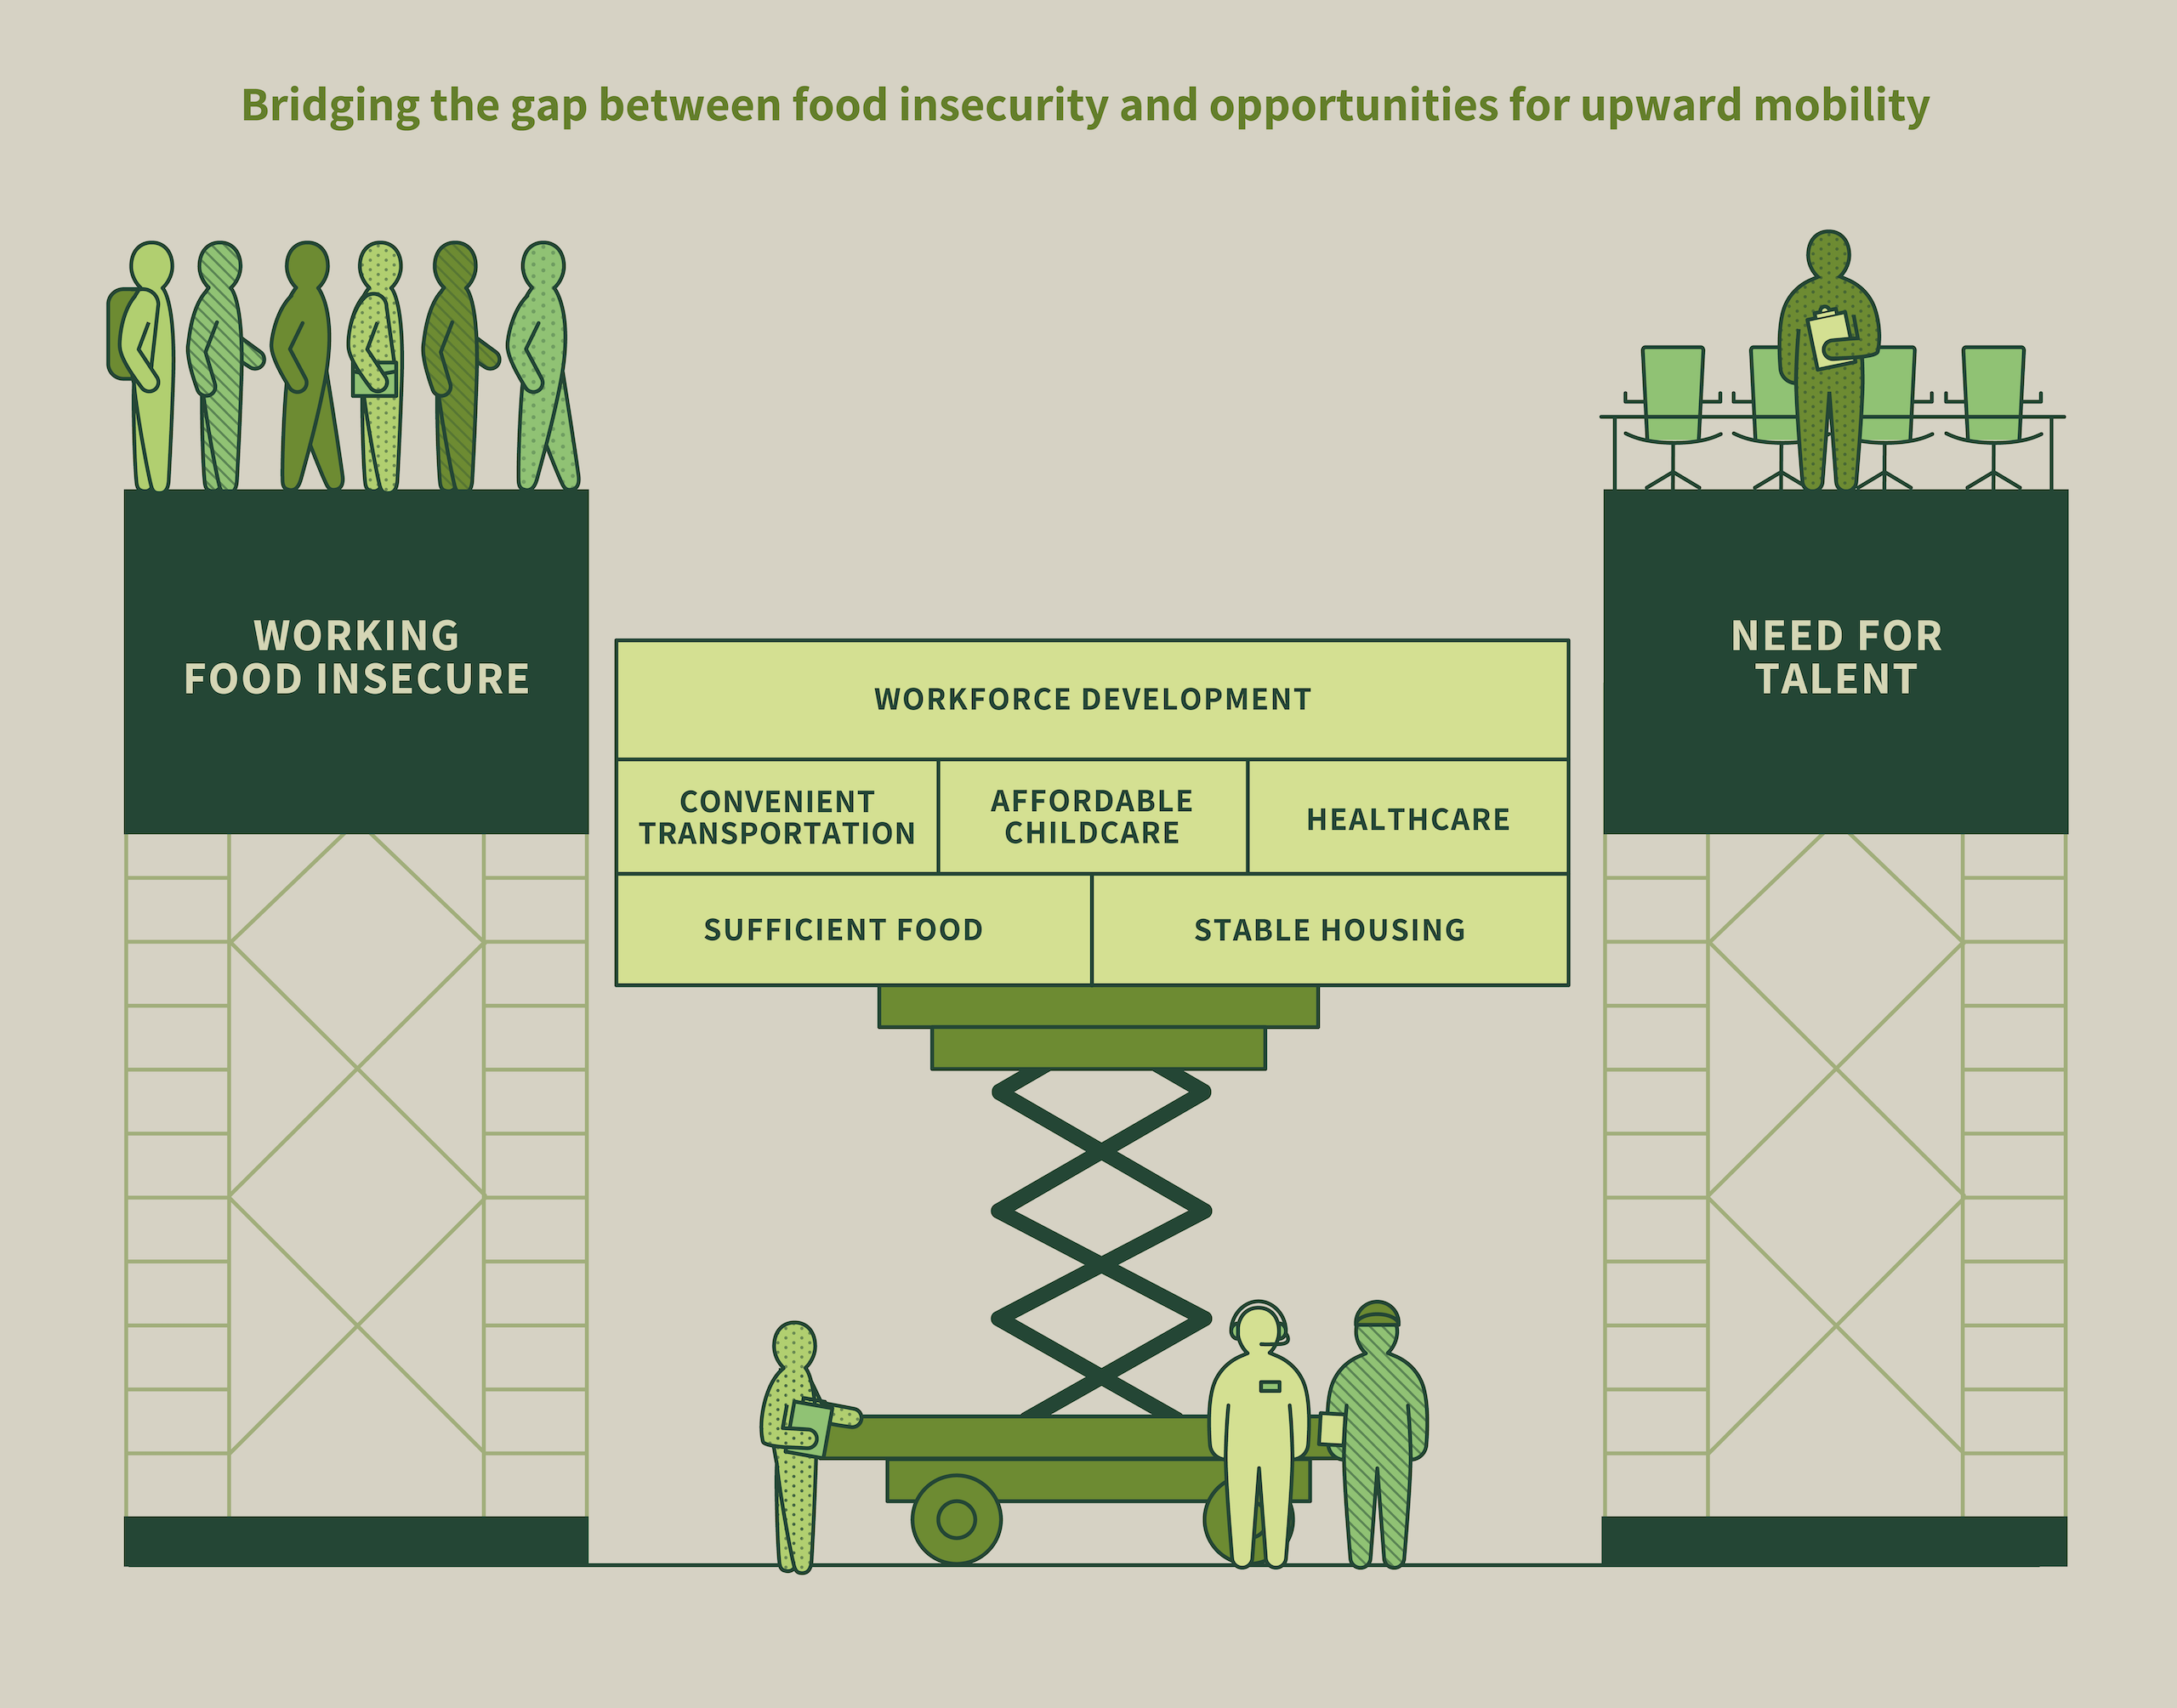
Collaboration between employers, workforce development, and social sector actors is critical for this kind of supportive, transformative programming. Employers have a stake in enabling the pipeline of diverse talent they need and can partner with workforce development actors to design trainings that produce employment-ready graduates. Several examples of these kinds of partnerships, particularly between big tech firms and community colleges, exist in the DMV.
Collaboration between employers, workforce development, and social sector actors is critical for this kind of supportive, transformative programming.
On the social sector side, nonprofits can align with workforce providers to enhance the wraparound services offered to program participants. The Capital Area Food Bank has been forging partnerships with community colleges and universities across the region to do just this, bundling free groceries with other academic and social supports for students pursuing workforce certificates, associate’s degrees, and bachelor’s degrees in the DMV.
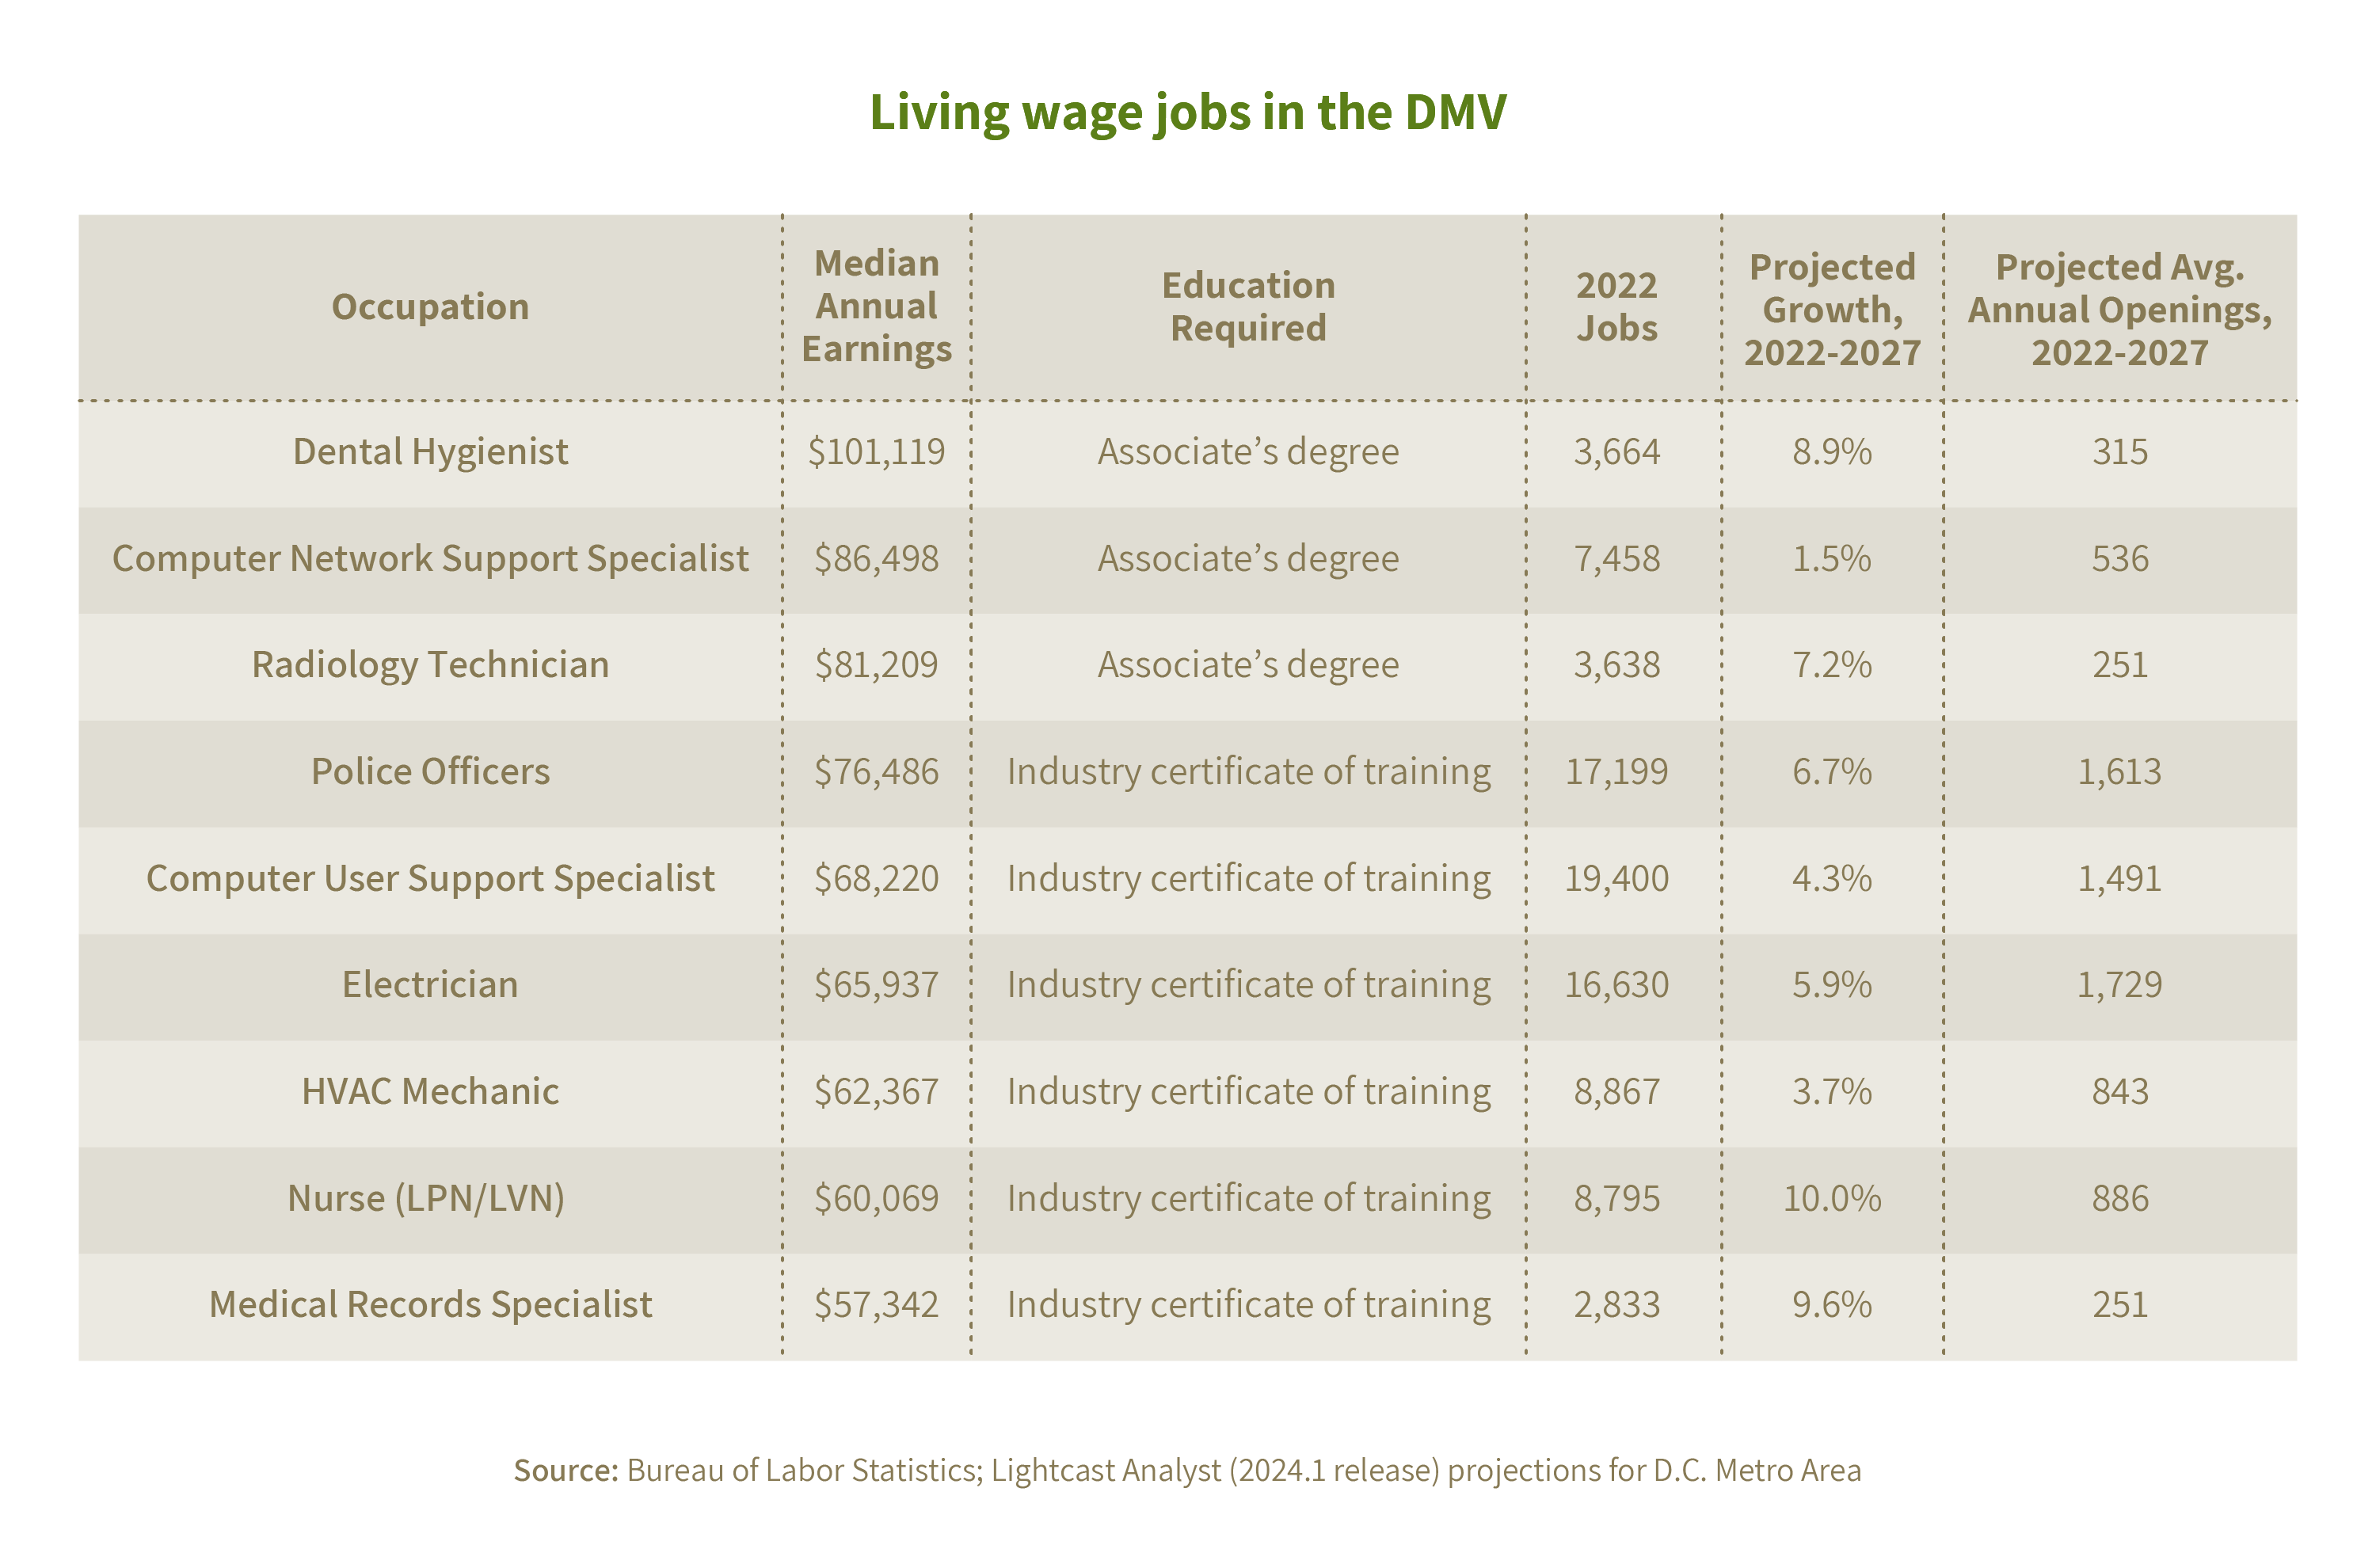
These programs target a mix of students, with a growing emphasis on programs that are preparing students for entry-level, living wage jobs – of which there are many in the region. The following table includes a sampling of occupations in the DC Metro Area that are growing in demand and pay a living wage without requiring a bachelor’s degree. Many of the food insecure students receiving support through these programs are on track for employment in some of these jobs.
Increase the accessibility of the emergency food assistance network
Last year’s CAFB-NORC report uncovered a critical finding: that approximately half of the food insecure population was not accessing any charitable food. This year, the proportion of food insecure people not availing themselves of support has increased from 46% to 54%, potentially due in part to the growth in food insecurity among households in higher income brackets.
The low levels of utilization of the food assistance network beg questions about what barriers people are experiencing to accessing charitable food. Accordingly, this year’s study included questions about these barriers to understand the relative impact of various forces and find suggestions for how to improve access. The findings are below:
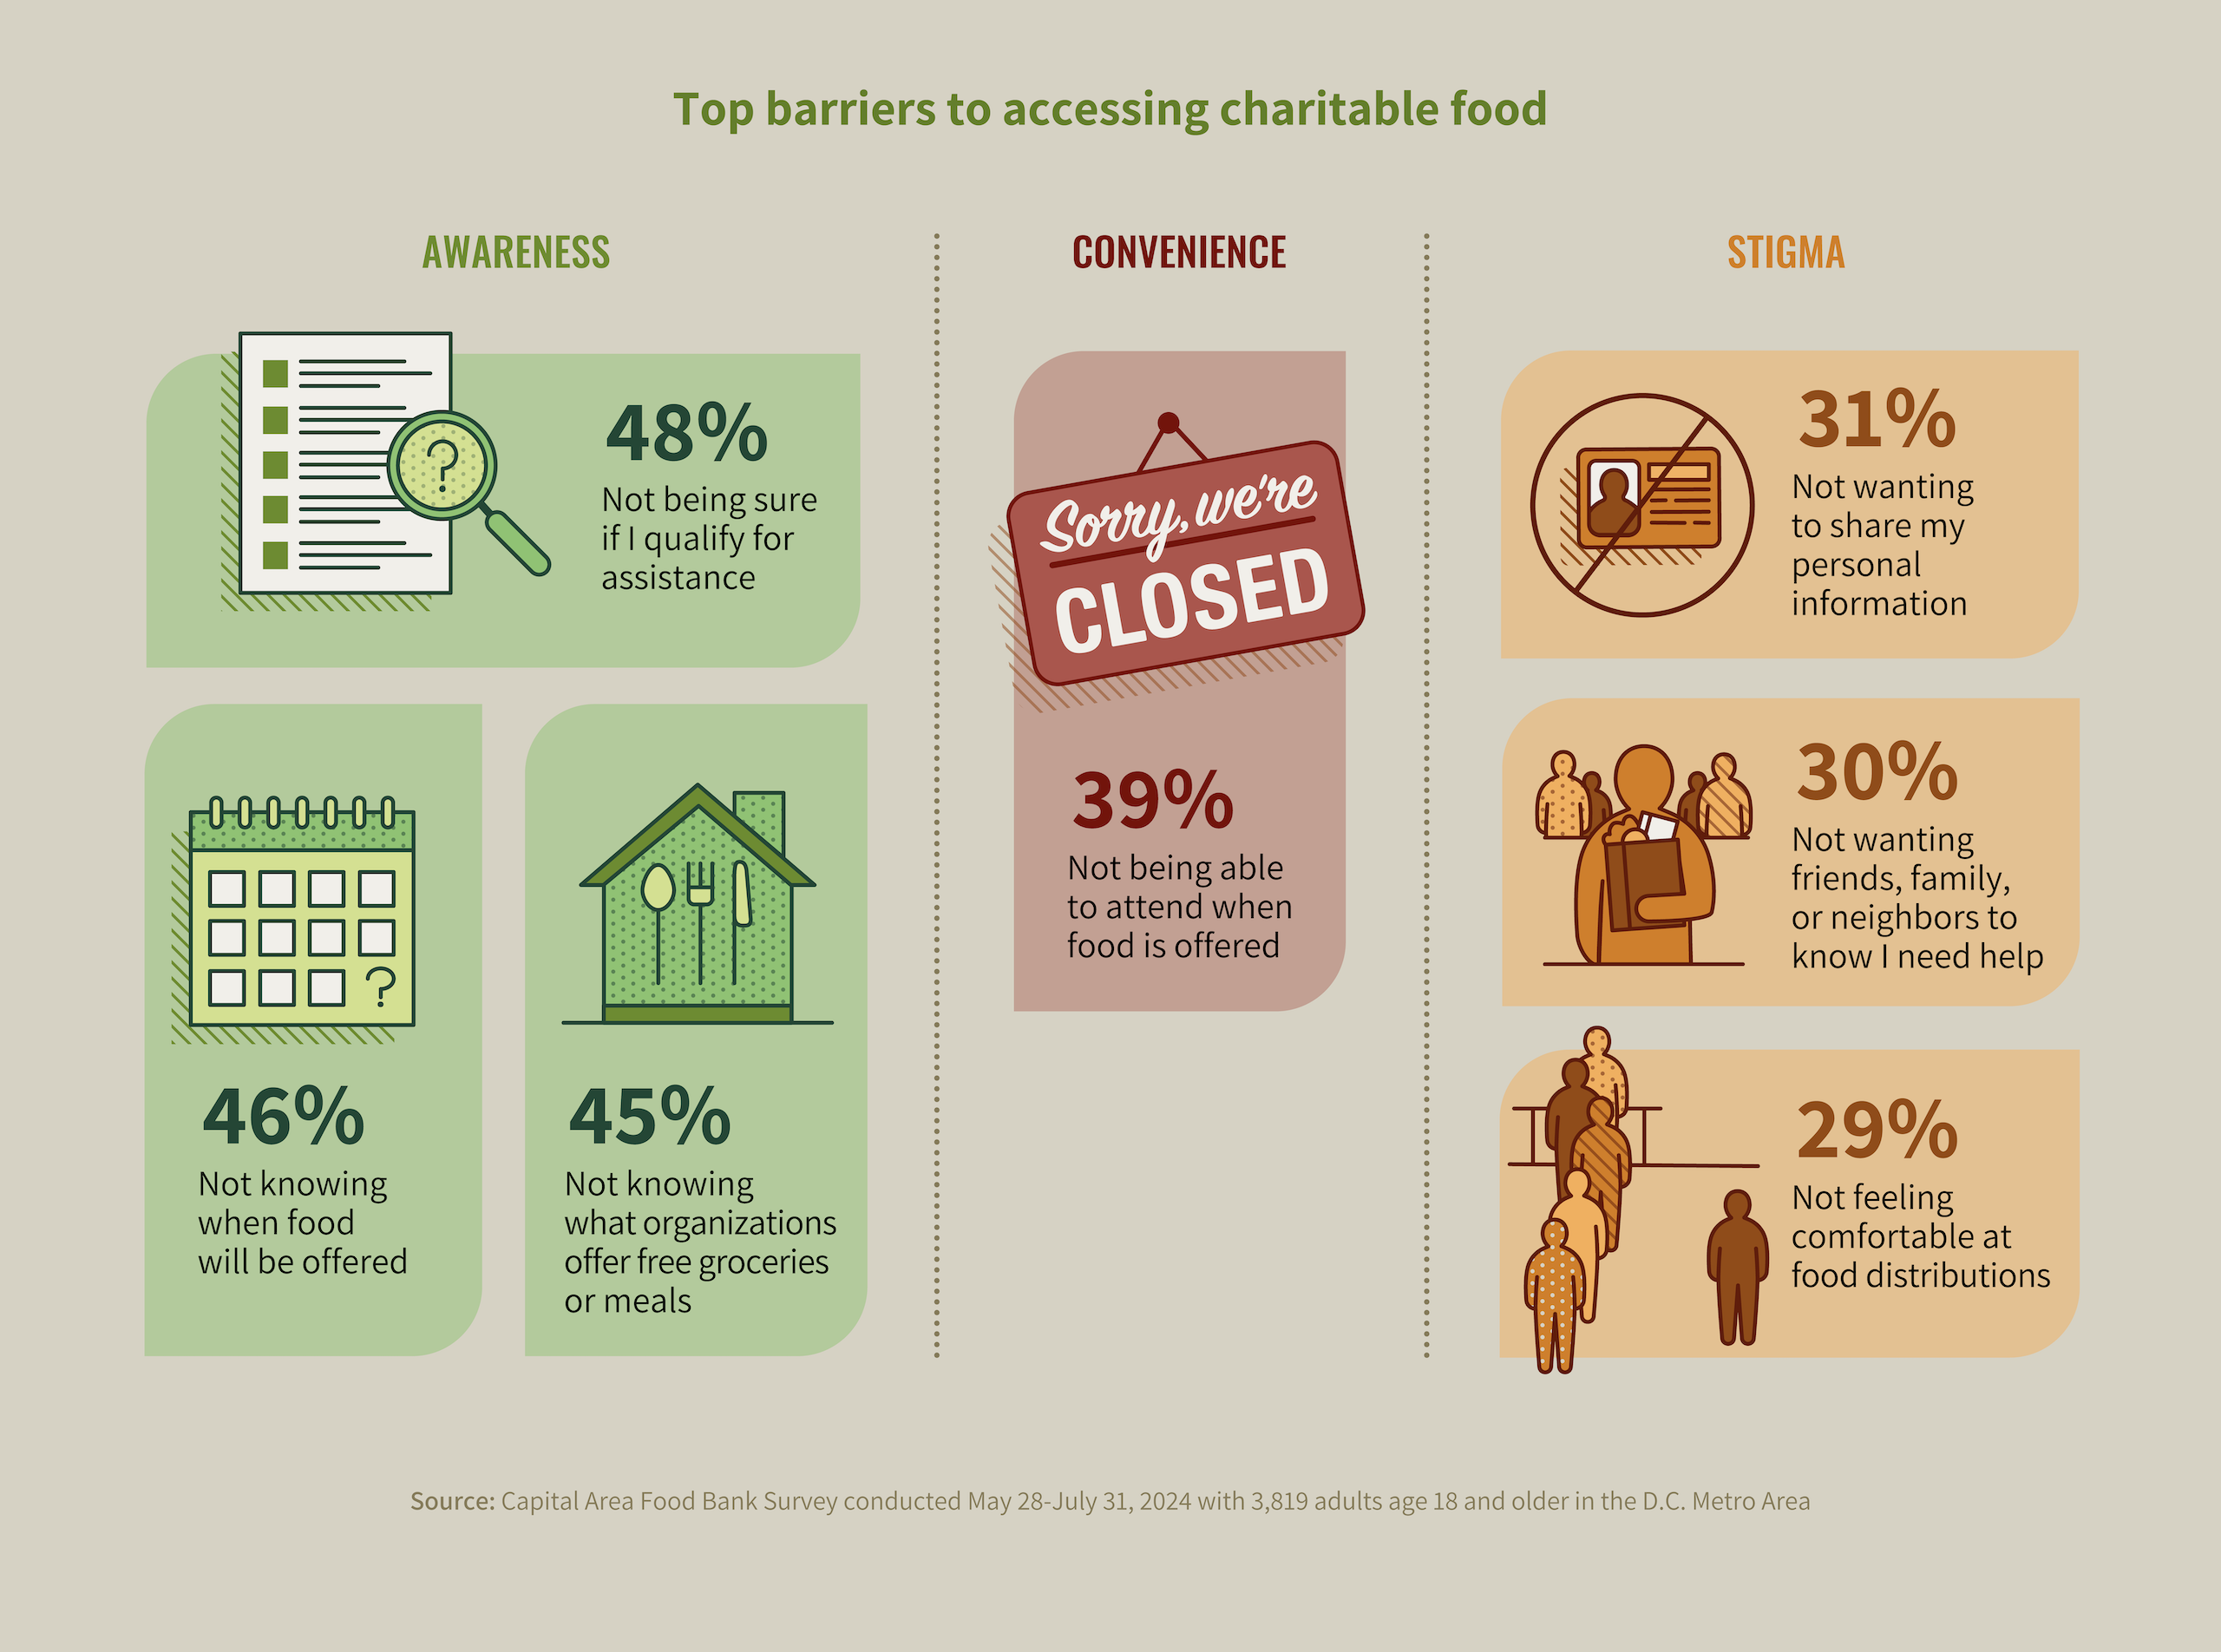
The top three barriers relate to awareness, which is a challenge, but fortunately not an intractable one. The charitable food network can work together to compile information on its services and make that information highly accessible through multiple channels and strategies. For example, an automated texting service that provides users with information about food pantries open near them; awareness campaigns about the vast network of free food resources in the DMV; and promotion of existing informational resources like CAFB’s Get Help map with other social service nonprofits, could all significantly drive awareness and utilization of food pantries in the region.
The fourth barrier relates to the hours of operation of the network. The CAFB-NORC study also asked food insecure people when the most convenient time would be to access food pantries given their other obligations and access to transportation, and the majority of respondents said weekends over weekdays. Comparing this to the composite hours of operation among the several hundred sites CAFB supports, there is a significant opportunity to reach more people by offering expanded weekend hours.
The fifth through seventh barriers are primarily psychological and relate to the stigma associated with charitable food. This is a complex barrier, but it can be addressed through more culturally familiar service delivery (culturally familiar foods, staff and volunteers that reflect the diversity of the communities they serve, signage in multiple languages, etc.), as well as trauma-informed care training for staff and volunteers, and limiting data collection to only what’s necessary.
The Capital Area Food Bank is engaged in a multi-year, network-wide strategy to address these barriers (and more) across the region. The guiding principles of the work are client centricity, equitable access, and addressing the root causes of food insecurity, with key outcomes in the community including:
- More diverse and convenient locations for accessing free food
- More equitable access to charitable food by geography within the region
- Greater use of referrals between food relief and other social service organizations
- More culturally familiar foods offered across the network
- Greater language capabilities among staff and volunteers at food distributions
These outcomes are not for the charitable food system to pursue alone but require participation from many different stakeholders. New types of partnerships between food relief actors and social service agencies, cultural centers, libraries, the growing home delivery infrastructure, and more are necessary to expand the reach of this support to those who need it.


Conclusion
Despite the largely rosy reports of an economy that has seemingly regained its strength and health post-pandemic, the data are clear that these gains are not being felt equally. Rather, disparities in metropolitan Washington have only continued to deepen, and as a result, more people are experiencing financial hardship and the difficult realities – including food insecurity – that come with it.
The toll this takes is profound. More and more individuals without consistent access to nutritious food are facing an uphill battle to focus, stay healthy, and succeed in school and on the job. This can hamper their ability to meet their full potential in all aspects of life, both in the short and longer term, diminishing future opportunities and earning power. And these impacts on individuals, in turn, threaten the well-being of communities across our area.
These repercussions will only grow more severe over time should the trends in this report continue in the current direction. Increasing hunger and inequity will create greater individual and community suffering, while also harming our region’s ability to meet its talent needs and stay competitive.
These issues affect us all. And solving them will require our collective commitment to solutions that will stop these socioeconomic gaps from widening and begin to reverse this troubling trajectory. Through concerted investment in thoughtful policy, programs, and practices, we can – and must – create a future where our neighbors have the support and resources they need so that all of us can thrive.

 “Our region holds enormous potential, but widespread hunger and the inequities that underlie it are major obstacles to achieving all that we’re capable of, impacting everything from educational attainment and health to workforce readiness, our talent pathways, and economic competitiveness. That’s why addressing these challenges benefits everyone. When our region comes together, we can do big things and solve hard problems. Through thoughtful policy, innovation, and a real commitment to collaboration across every sector, we can build long-term economic strength and stability, generate greater opportunities, and create a more inclusive region where no one is left behind.”
 “The research is incredibly clear that our health is deeply impacted by many factors beyond medical care alone – including the food we eat. Innovative programs that are helping people manage, or prevent, diet-related illness through nutrition have great potential to help more of our region’s residents thrive while simultaneously reducing health care costs. The full impact of these programs can only be realized by bringing them to scale, and making them a regular, reimbursable part of health care – something that states can play a critical role in advancing.”
 “For several years, employers in Northern Virginia have faced a significant challenge in finding and retaining skilled talent in a tight labor market. They recognize the value of a workforce that reflects our diverse community, making it essential to build a pipeline of talent from varied economic backgrounds. This approach not only drives business growth but also enhances the economic prospects of our community.”
 “At Northern Virginia Community College, the region’s largest supplier of talent, our mission is to provide affordable, exceptional education that transforms the lives of our students. We know that many of our students—and prospective students—are outside of economic opportunity trying to find a way in. Their pathways to the jobs of the future are blocked by their present challenges, including food insecurity. This is why we partner with the Capital Area Food Bank—to remove the barriers that knock our students off track and prevent them from completing programs that lead to in-demand careers and jobs that pay a living wage. We are grateful to the Capital Area Food Bank for working with NOVA to set our students up for success at our college and beyond.”
 “The population experiencing food insecurity is also experiencing insecurity in a myriad of other areas – housing, transportation, childcare, employment, etc. Our responsibility as a network of solutions-based providers is to support this population in meeting their needs. The heavy burden of navigating complex systems, gathering difficult-to-find information or visiting multiple locations to access support can be daunting. We have a significant opportunity to make it easier to access the help they need.”